| Red | Green | Blue | |
| z | 17.64 | ||
| znorm | Inf | ||
| sky | -Inf | -Inf | -NaN |
| S/N | 32.9 | 49.8 | 56.9 |
| S/N(c) | 72.8 | 15.7 | 0.0 |
| SN(E/C) |
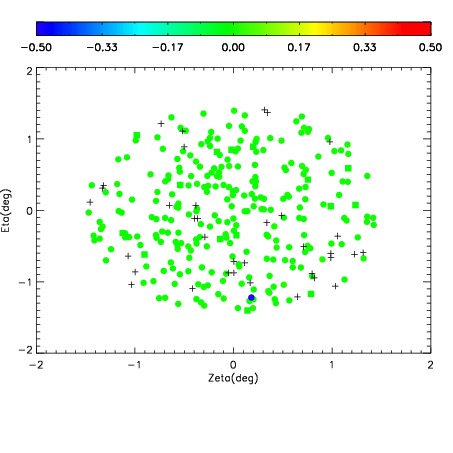
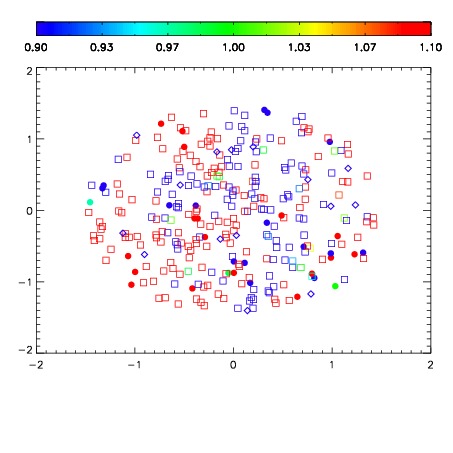
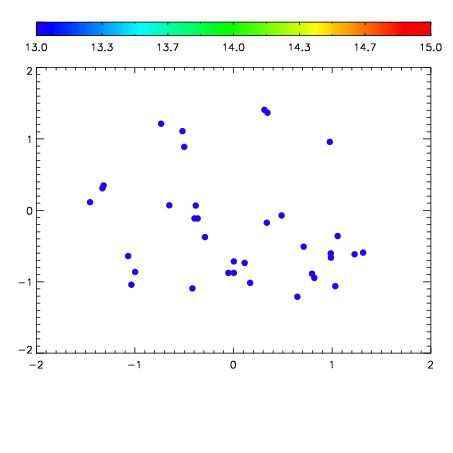

| Frame | Nreads | Zeropoints | Mag plots | Spatial mag deviation | Spatial sky 16325A emission deviations (filled: sky, open: star) | Spatial sky continuum emission | Spatial sky telluric CO2 absorption deviations (filled: H < 10) | |||||||||||||||||||||||
| 0 | 0 |
|
|
|
|
|
|
| IPAIR | NAME | SHIFT | NEWSHIFT | S/N | NAME | SHIFT | NEWSHIFT | S/N |
| 0 | 19100052 | 0.00000 | 0.00000 | 19.6894 | 19100054 | -0.506167 | 0.506167 | 19.7118 |
| 1 | 19100055 | -0.00328793 | 0.00328793 | 19.8166 | 19100053 | -0.505177 | 0.505177 | 19.8353 |