| Red | Green | Blue | |
| z | 17.65 | ||
| znorm | Inf | ||
| sky | -Inf | -Inf | -Inf |
| S/N | 23.6 | 39.1 | 45.7 |
| S/N(c) | 41.9 | 35.8 | 59.1 |
| SN(E/C) |

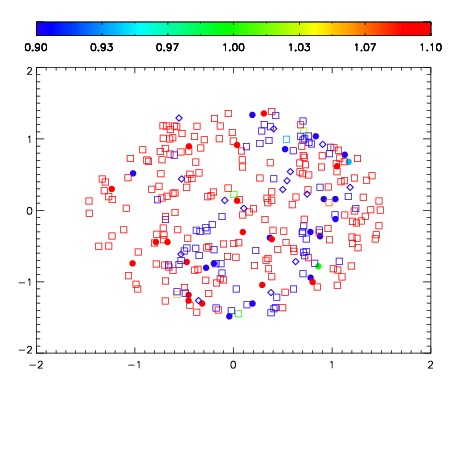


| Frame | Nreads | Zeropoints | Mag plots | Spatial mag deviation | Spatial sky 16325A emission deviations (filled: sky, open: star) | Spatial sky continuum emission | Spatial sky telluric CO2 absorption deviations (filled: H < 10) | |||||||||||||||||||||||
| 0 | 0 |
|
|
|
|
|
|
| IPAIR | NAME | SHIFT | NEWSHIFT | S/N | NAME | SHIFT | NEWSHIFT | S/N |
| 0 | 19340041 | 0.00000 | 0.00000 | 18.6161 | 19340042 | -0.491966 | 0.491966 | 18.6047 |
| 1 | 19340044 | -0.000971530 | 0.000971530 | 18.4450 | 19340043 | -0.491873 | 0.491873 | 18.5017 |
| 2 | 19340045 | -0.000275021 | 0.000275021 | 18.4113 | 19340046 | -0.492676 | 0.492676 | 18.4625 |
| 3 | 19340048 | -0.00418896 | 0.00418896 | 18.2466 | 19340047 | -0.493518 | 0.493518 | 18.3612 |