| Red | Green | Blue | |
| z | 17.64 | ||
| znorm | Inf | ||
| sky | -Inf | -Inf | -NaN |
| S/N | 28.8 | 46.7 | 54.1 |
| S/N(c) | 46.9 | 58.1 | 48.1 |
| SN(E/C) |
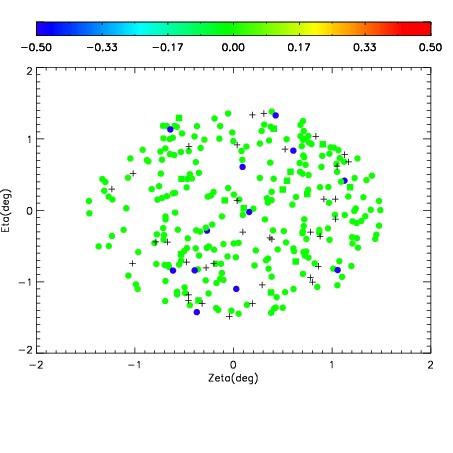
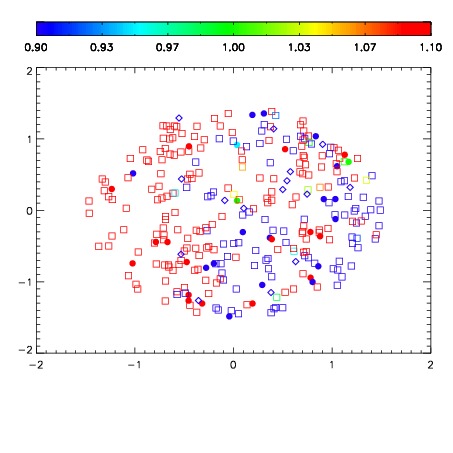


| Frame | Nreads | Zeropoints | Mag plots | Spatial mag deviation | Spatial sky 16325A emission deviations (filled: sky, open: star) | Spatial sky continuum emission | Spatial sky telluric CO2 absorption deviations (filled: H < 10) | |||||||||||||||||||||||
| 0 | 0 |
|
|
|
|
|
|
| IPAIR | NAME | SHIFT | NEWSHIFT | S/N | NAME | SHIFT | NEWSHIFT | S/N |
| 0 | 19370047 | 0.00374671 | 0.00000 | 18.8533 | 19370045 | -0.485078 | 0.488825 | 18.8478 |
| 1 | 19370043 | 0.00288918 | 0.000857530 | 18.8729 | 19370042 | -0.485206 | 0.488953 | 18.9056 |
| 2 | 19370044 | 0.00329215 | 0.000454560 | 18.8640 | 19370046 | -0.485417 | 0.489164 | 18.8739 |
| 3 | 19370040 | 0.00000 | 0.00374671 | 18.8540 | 19370041 | -0.485381 | 0.489128 | 18.8651 |