| Red | Green | Blue | |
| z | 17.64 | ||
| znorm | Inf | ||
| sky | -Inf | -NaN | -Inf |
| S/N | 27.2 | 43.6 | 52.3 |
| S/N(c) | 35.9 | 0.7 | 36.6 |
| SN(E/C) |
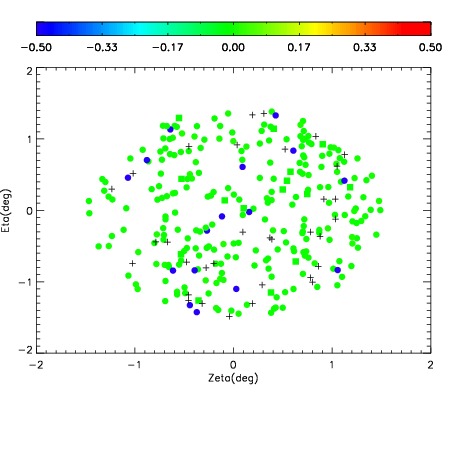
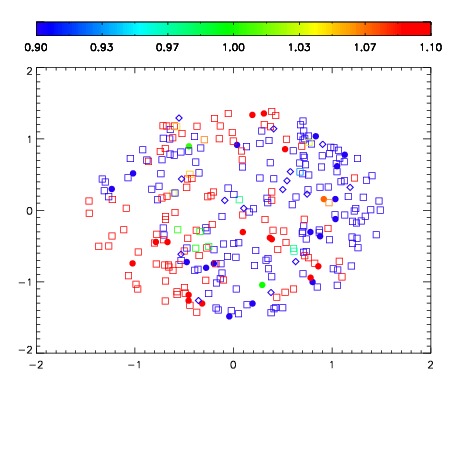


| Frame | Nreads | Zeropoints | Mag plots | Spatial mag deviation | Spatial sky 16325A emission deviations (filled: sky, open: star) | Spatial sky continuum emission | Spatial sky telluric CO2 absorption deviations (filled: H < 10) | |||||||||||||||||||||||
| 0 | 0 |
|
|
|
|
|
|
| IPAIR | NAME | SHIFT | NEWSHIFT | S/N | NAME | SHIFT | NEWSHIFT | S/N |
| 0 | 19680024 | 0.490493 | 0.00000 | 17.1881 | 19680029 | 0.00127896 | 0.489214 | 18.4026 |
| 1 | 19680023 | 0.488830 | 0.00166300 | 18.8974 | 19680022 | 0.00000 | 0.490493 | 18.7794 |
| 2 | 19680027 | 0.488603 | 0.00189000 | 18.7916 | 19680026 | -0.000984064 | 0.491477 | 18.6352 |
| 3 | 19680028 | 0.489175 | 0.00131801 | 18.6725 | 19680025 | -0.000369984 | 0.490863 | 18.6126 |