| Red | Green | Blue | |
| z | 17.64 | ||
| znorm | Inf | ||
| sky | -Inf | -NaN | -NaN |
| S/N | 27.0 | 41.4 | 51.6 |
| S/N(c) | 32.5 | 50.5 | 55.4 |
| SN(E/C) |
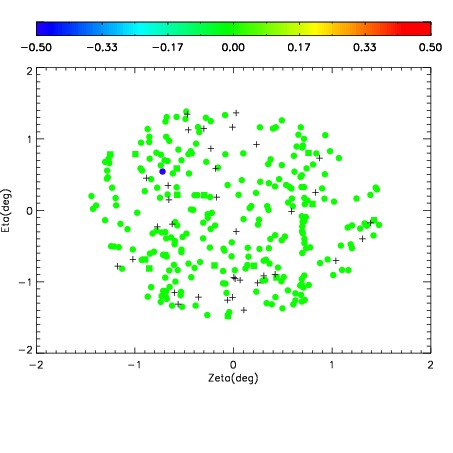
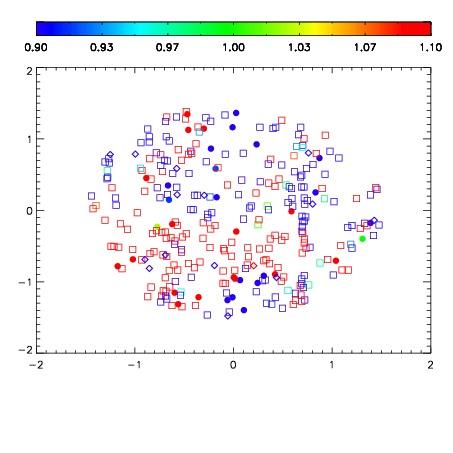
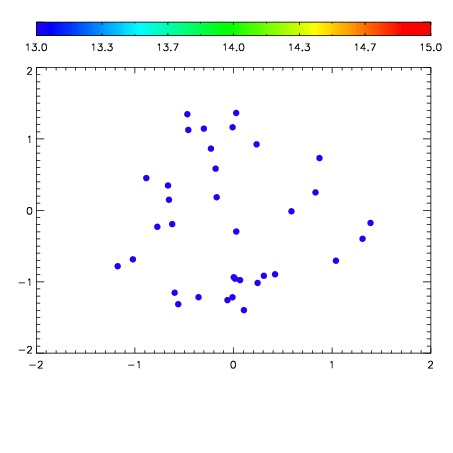

| Frame | Nreads | Zeropoints | Mag plots | Spatial mag deviation | Spatial sky 16325A emission deviations (filled: sky, open: star) | Spatial sky continuum emission | Spatial sky telluric CO2 absorption deviations (filled: H < 10) | |||||||||||||||||||||||
| 0 | 0 |
|
|
|
|
|
|
| IPAIR | NAME | SHIFT | NEWSHIFT | S/N | NAME | SHIFT | NEWSHIFT | S/N |
| 0 | 19070067 | 0.499543 | 0.00000 | 18.8346 | 19070068 | 0.000409735 | 0.499133 | 18.6332 |
| 1 | 19070062 | 0.498044 | 0.00149900 | 18.9305 | 19070064 | 0.000437493 | 0.499106 | 18.8890 |
| 2 | 19070066 | 0.498914 | 0.000629008 | 18.8947 | 19070061 | 0.00000 | 0.499543 | 18.8820 |
| 3 | 19070063 | 0.498860 | 0.000683010 | 18.8570 | 19070065 | 0.000391203 | 0.499152 | 18.7657 |