| Red | Green | Blue | |
| z | 17.64 | ||
| znorm | Inf | ||
| sky | -Inf | -Inf | -Inf |
| S/N | 38.5 | 58.6 | 73.1 |
| S/N(c) | 45.2 | 70.9 | 78.7 |
| SN(E/C) |
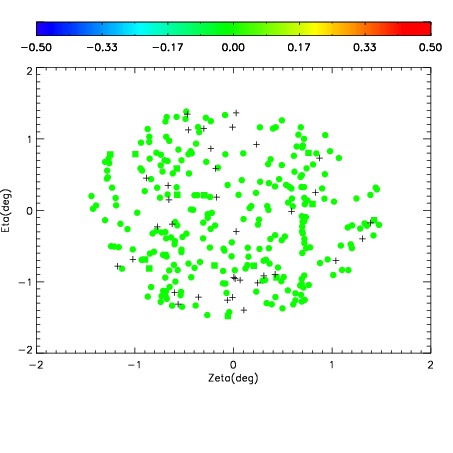
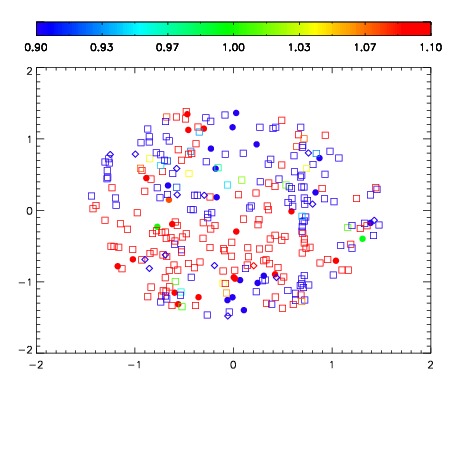
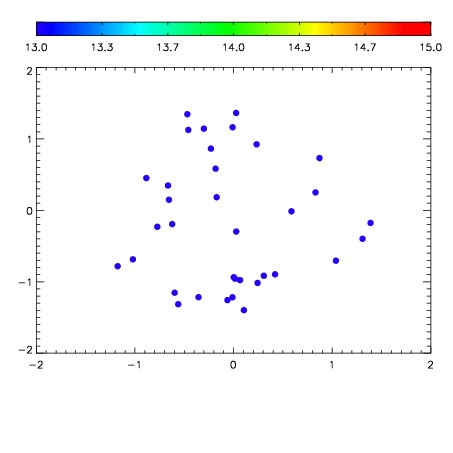

| Frame | Nreads | Zeropoints | Mag plots | Spatial mag deviation | Spatial sky 16325A emission deviations (filled: sky, open: star) | Spatial sky continuum emission | Spatial sky telluric CO2 absorption deviations (filled: H < 10) | |||||||||||||||||||||||
| 0 | 0 |
|
|
|
|
|
|
| IPAIR | NAME | SHIFT | NEWSHIFT | S/N | NAME | SHIFT | NEWSHIFT | S/N |
| 0 | 19100066 | 0.00203734 | 0.00000 | 18.9234 | 19100065 | -0.503121 | 0.505158 | 18.9469 |
| 1 | 19100063 | 0.00113071 | 0.000906630 | 19.0290 | 19100061 | -0.502597 | 0.504634 | 19.0421 |
| 2 | 19100062 | 0.00116203 | 0.000875310 | 19.0215 | 19100064 | -0.502911 | 0.504948 | 19.0100 |
| 3 | 19100059 | 0.00000 | 0.00203734 | 19.0209 | 19100060 | -0.502181 | 0.504218 | 19.0030 |
| 4 | 19100070 | -0.000806468 | 0.00284381 | 19.0104 | 19100069 | -0.503212 | 0.505249 | 18.9988 |
| 5 | 19100071 | -0.000893925 | 0.00293127 | 18.9490 | 19100072 | -0.506561 | 0.508598 | 18.9849 |
| 6 | 19100067 | 0.00196873 | 6.86101e-05 | 18.8939 | 19100068 | -0.502856 | 0.504893 | 18.9284 |