| Red | Green | Blue | |
| z | 17.63 | ||
| znorm | Inf | ||
| sky | -NaN | -NaN | -NaN |
| S/N | 22.4 | 34.4 | 42.1 |
| S/N(c) | 0.5 | 31.3 | 41.8 |
| SN(E/C) |

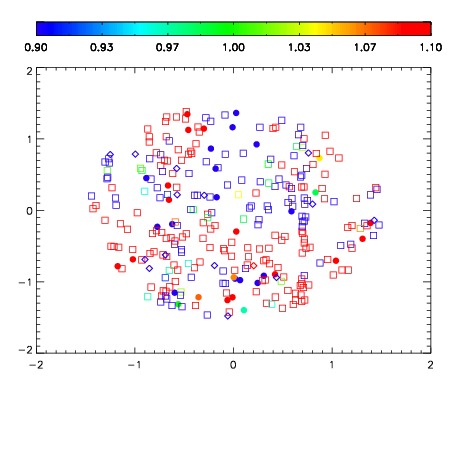
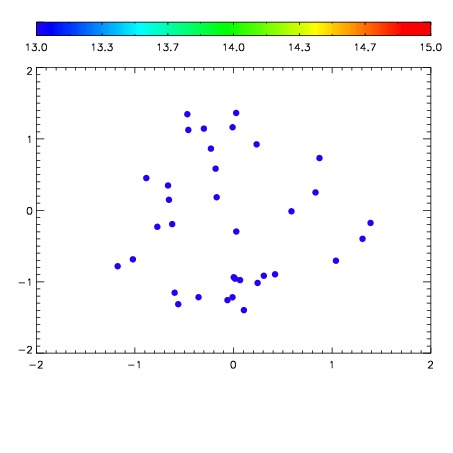

| Frame | Nreads | Zeropoints | Mag plots | Spatial mag deviation | Spatial sky 16325A emission deviations (filled: sky, open: star) | Spatial sky continuum emission | Spatial sky telluric CO2 absorption deviations (filled: H < 10) | |||||||||||||||||||||||
| 0 | 0 |
|
|
|
|
|
|
| IPAIR | NAME | SHIFT | NEWSHIFT | S/N | NAME | SHIFT | NEWSHIFT | S/N |
| 0 | 19130072 | 0.000796855 | 0.00000 | 19.1306 | 19130071 | -0.503718 | 0.504515 | 19.1219 |
| 1 | 19130069 | 0.00000 | 0.000796855 | 19.0911 | 19130070 | -0.503935 | 0.504732 | 19.1028 |