| Red | Green | Blue | |
| z | 17.64 | ||
| znorm | Inf | ||
| sky | -Inf | -Inf | -NaN |
| S/N | 23.9 | 37.4 | 47.0 |
| S/N(c) | 26.0 | 41.6 | 52.0 |
| SN(E/C) |
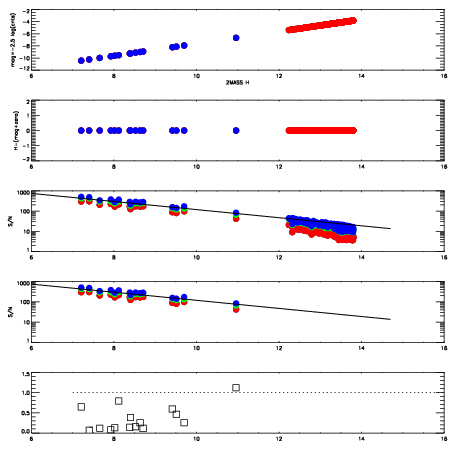
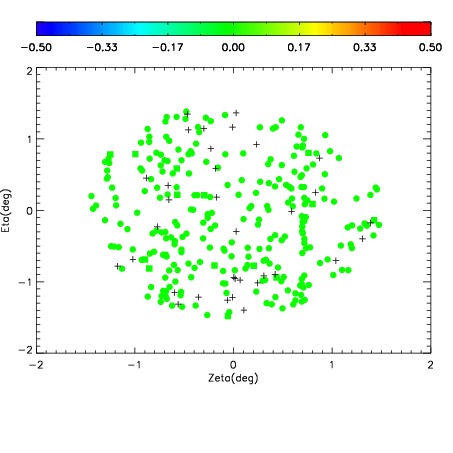
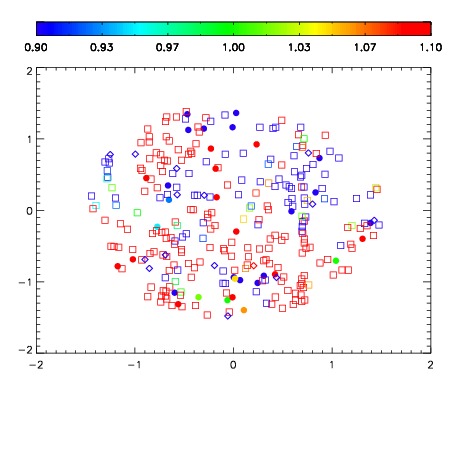
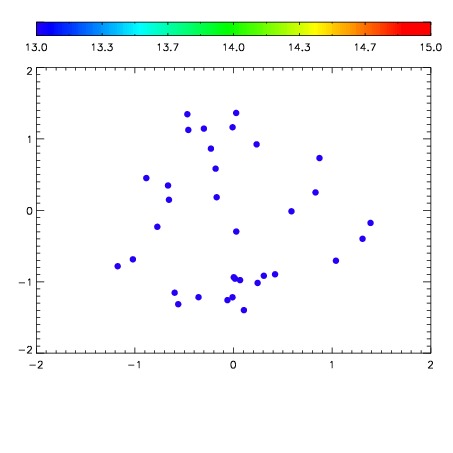

| Frame | Nreads | Zeropoints | Mag plots | Spatial mag deviation | Spatial sky 16325A emission deviations (filled: sky, open: star) | Spatial sky continuum emission | Spatial sky telluric CO2 absorption deviations (filled: H < 10) | |||||||||||||||||||||||
| 0 | 0 |
|
|
|
|
|
|
| IPAIR | NAME | SHIFT | NEWSHIFT | S/N | NAME | SHIFT | NEWSHIFT | S/N |
| 0 | 19180013 | 0.505075 | 0.00000 | 18.5314 | 19180014 | 0.00221667 | 0.502858 | 18.6208 |
| 1 | 19180012 | 0.504953 | 0.000121951 | 18.6468 | 19180015 | 0.00128668 | 0.503788 | 18.7011 |
| 2 | 19180017 | 0.503763 | 0.00131196 | 18.6406 | 19180011 | 0.00000 | 0.505075 | 18.6845 |
| 3 | 19180016 | 0.503613 | 0.00146198 | 18.5850 | 19180018 | -0.00149574 | 0.506571 | 18.6354 |