| Red | Green | Blue | |
| z | 17.64 | ||
| znorm | Inf | ||
| sky | -Inf | -Inf | -NaN |
| S/N | 26.1 | 40.1 | 51.3 |
| S/N(c) | 27.6 | 42.8 | 1.0 |
| SN(E/C) |
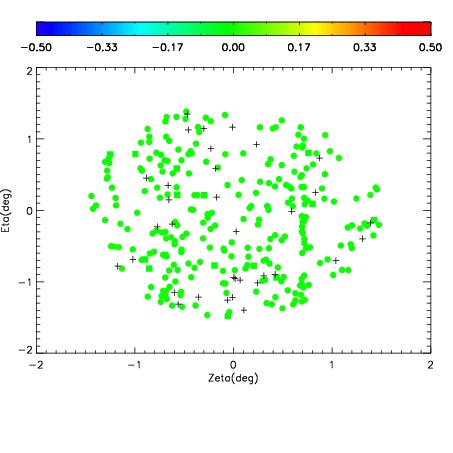
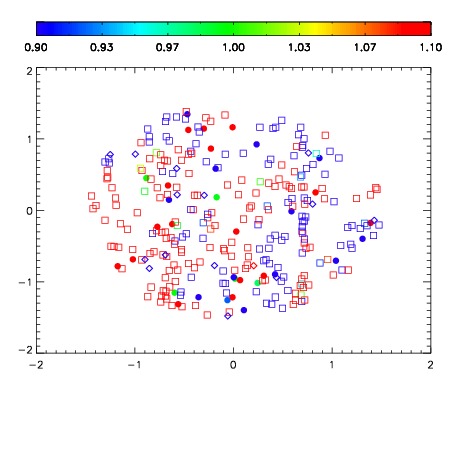
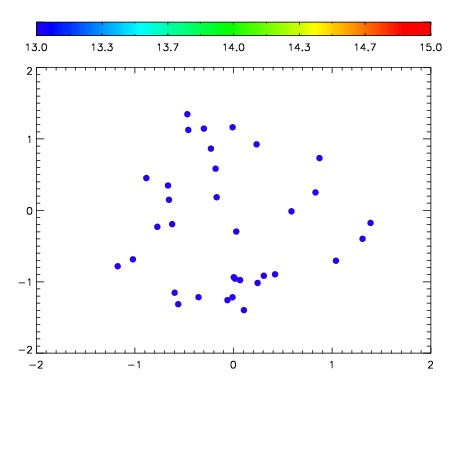

| Frame | Nreads | Zeropoints | Mag plots | Spatial mag deviation | Spatial sky 16325A emission deviations (filled: sky, open: star) | Spatial sky continuum emission | Spatial sky telluric CO2 absorption deviations (filled: H < 10) | |||||||||||||||||||||||
| 0 | 0 |
|
|
|
|
|
|
| IPAIR | NAME | SHIFT | NEWSHIFT | S/N | NAME | SHIFT | NEWSHIFT | S/N |
| 0 | 19380049 | 0.491072 | 0.00000 | 18.4165 | 19380050 | -0.00111423 | 0.492186 | 18.6047 |
| 1 | 19380053 | 0.490264 | 0.000808001 | 18.8633 | 19380054 | -0.00251130 | 0.493583 | 18.7984 |
| 2 | 19380052 | 0.489945 | 0.00112700 | 18.6428 | 19380051 | -0.00177577 | 0.492848 | 18.6571 |
| 3 | 19380048 | 0.490995 | 7.70092e-05 | 18.4926 | 19380047 | 0.00000 | 0.491072 | 18.6451 |