| Red | Green | Blue | |
| z | 17.64 | ||
| znorm | Inf | ||
| sky | -Inf | -Inf | -Inf |
| S/N | 15.6 | 26.3 | 30.3 |
| S/N(c) | 17.2 | 21.5 | 30.5 |
| SN(E/C) |
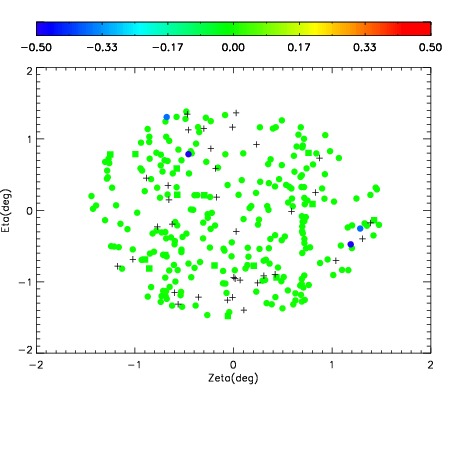
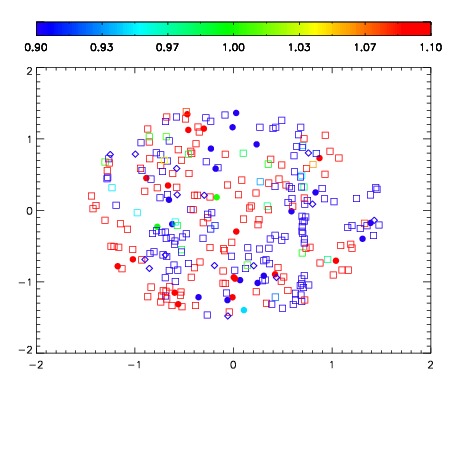
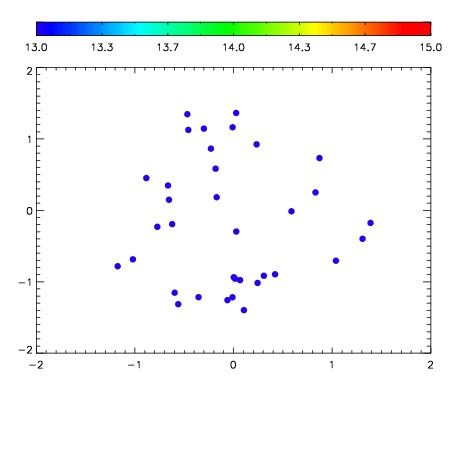

| Frame | Nreads | Zeropoints | Mag plots | Spatial mag deviation | Spatial sky 16325A emission deviations (filled: sky, open: star) | Spatial sky continuum emission | Spatial sky telluric CO2 absorption deviations (filled: H < 10) | |||||||||||||||||||||||
| 0 | 0 |
|
|
|
|
|
|
| IPAIR | NAME | SHIFT | NEWSHIFT | S/N | NAME | SHIFT | NEWSHIFT | S/N |
| 0 | 19980031 | 0.502419 | 0.00000 | 18.2323 | 19980032 | -0.00109197 | 0.503511 | 18.2881 |
| 1 | 19980030 | 0.501433 | 0.000985980 | 18.2591 | 19980029 | 0.00000 | 0.502419 | 18.3463 |