| Red | Green | Blue | |
| z | 17.64 | ||
| znorm | Inf | ||
| sky | -Inf | -Inf | -Inf |
| S/N | 34.8 | 56.6 | 64.5 |
| S/N(c) | 36.5 | 46.9 | 63.2 |
| SN(E/C) |
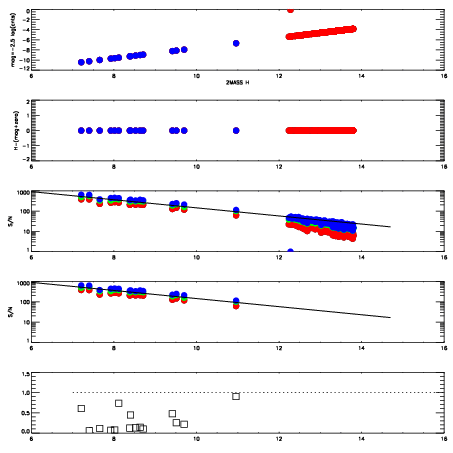
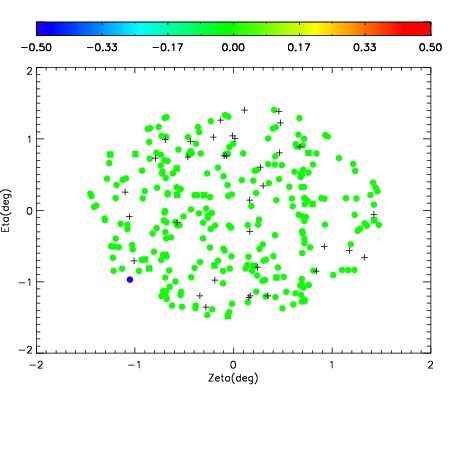
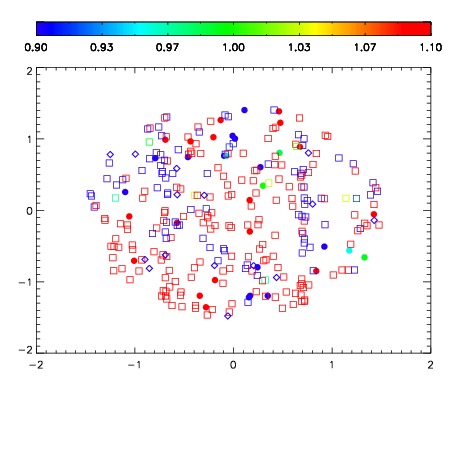
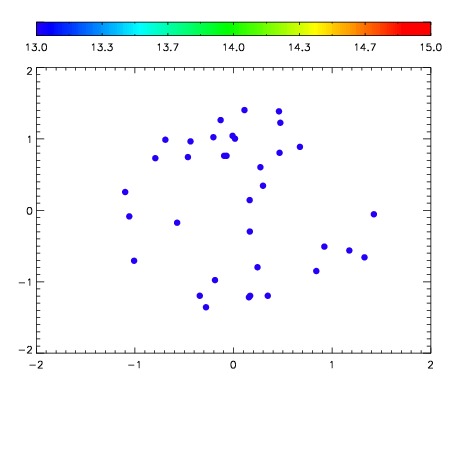

| Frame | Nreads | Zeropoints | Mag plots | Spatial mag deviation | Spatial sky 16325A emission deviations (filled: sky, open: star) | Spatial sky continuum emission | Spatial sky telluric CO2 absorption deviations (filled: H < 10) | |||||||||||||||||||||||
| 0 | 0 |
|
|
|
|
|
|
| IPAIR | NAME | SHIFT | NEWSHIFT | S/N | NAME | SHIFT | NEWSHIFT | S/N |
| 0 | 19090070 | 0.00399107 | 0.00000 | 18.6148 | 19090068 | -0.508969 | 0.512960 | 18.2888 |
| 1 | 19090073 | -0.00722594 | 0.0112170 | 18.9879 | 19090072 | -0.510800 | 0.514791 | 18.9320 |
| 2 | 19090062 | 0.00000 | 0.00399107 | 18.7576 | 19090071 | -0.510111 | 0.514102 | 18.9261 |
| 3 | 19090065 | 0.000458951 | 0.00353212 | 18.7420 | 19090064 | -0.508823 | 0.512814 | 18.7053 |
| 4 | 19090066 | 0.000370874 | 0.00362020 | 18.6829 | 19090063 | -0.508175 | 0.512166 | 18.5446 |
| 5 | 19090069 | 0.00385640 | 0.000134670 | 18.5357 | 19090067 | -0.508629 | 0.512620 | 18.2611 |