| Red | Green | Blue | |
| z | 17.64 | ||
| znorm | Inf | ||
| sky | -NaN | -NaN | -NaN |
| S/N | 29.9 | 45.7 | 57.2 |
| S/N(c) | 32.1 | 77.1 | 59.3 |
| SN(E/C) |
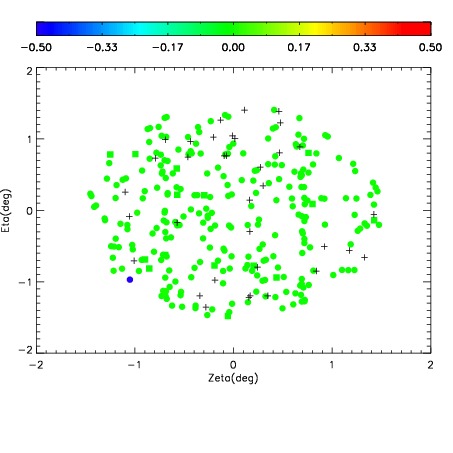
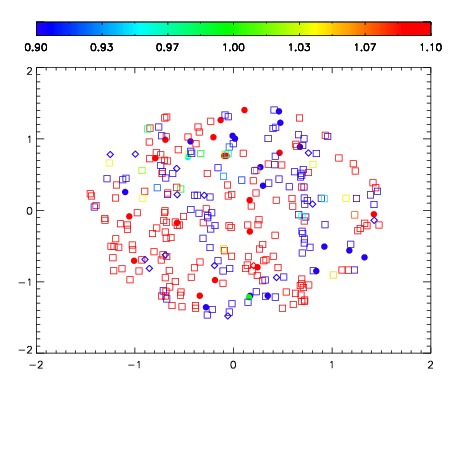
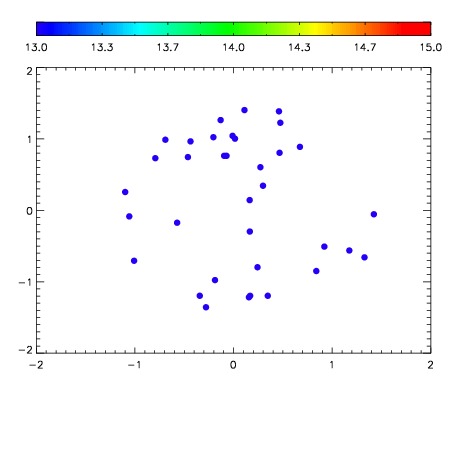

| Frame | Nreads | Zeropoints | Mag plots | Spatial mag deviation | Spatial sky 16325A emission deviations (filled: sky, open: star) | Spatial sky continuum emission | Spatial sky telluric CO2 absorption deviations (filled: H < 10) | |||||||||||||||||||||||
| 0 | 0 |
|
|
|
|
|
|
| IPAIR | NAME | SHIFT | NEWSHIFT | S/N | NAME | SHIFT | NEWSHIFT | S/N |
| 0 | 19120060 | 0.00157291 | 0.00000 | 18.7205 | 19120061 | -0.494971 | 0.496544 | 18.8081 |
| 1 | 19120056 | 0.00000 | 0.00157291 | 18.8504 | 19120062 | -0.495128 | 0.496701 | 18.8669 |
| 2 | 19120059 | 0.00147825 | 9.46600e-05 | 18.7761 | 19120057 | -0.495952 | 0.497525 | 18.8383 |
| 3 | 19120063 | 0.000981544 | 0.000591366 | 18.7347 | 19120058 | -0.495438 | 0.497011 | 18.8340 |