| Red | Green | Blue | |
| z | 17.65 | ||
| znorm | Inf | ||
| sky | -Inf | -Inf | -Inf |
| S/N | 13.9 | 25.5 | 28.8 |
| S/N(c) | 17.0 | 21.6 | 30.2 |
| SN(E/C) |
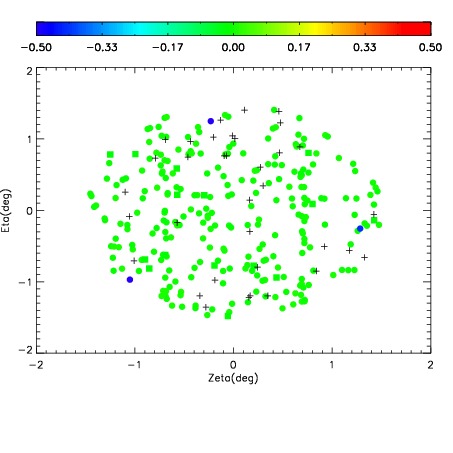
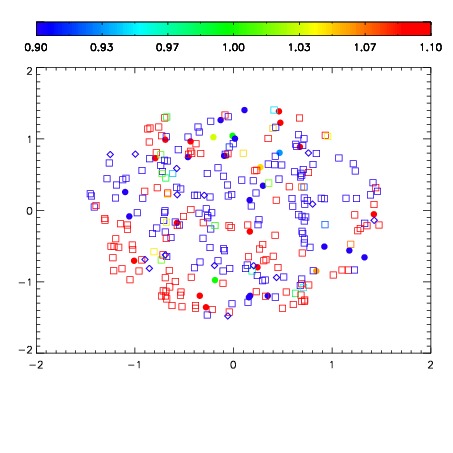
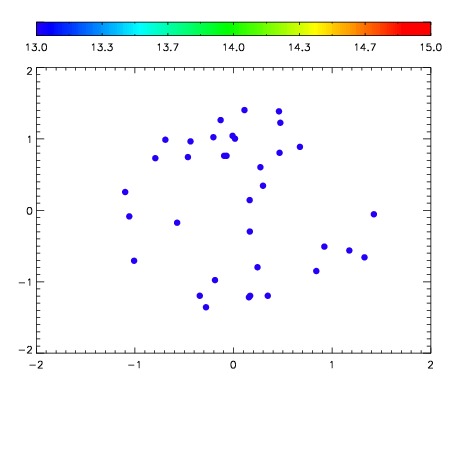

| Frame | Nreads | Zeropoints | Mag plots | Spatial mag deviation | Spatial sky 16325A emission deviations (filled: sky, open: star) | Spatial sky continuum emission | Spatial sky telluric CO2 absorption deviations (filled: H < 10) | |||||||||||||||||||||||
| 0 | 0 |
|
|
|
|
|
|
| IPAIR | NAME | SHIFT | NEWSHIFT | S/N | NAME | SHIFT | NEWSHIFT | S/N |
| 0 | 19420036 | 0.487000 | 0.00000 | 18.0519 | 19420035 | 0.00000 | 0.487000 | 18.3056 |
| 1 | 19420037 | 0.486372 | 0.000627995 | 17.5215 | 19420039 | 0.00198992 | 0.485010 | 17.3427 |
| 2 | 19420040 | 0.484182 | 0.00281799 | 17.4026 | 19420038 | 0.00193832 | 0.485062 | 16.9921 |
| 3 | 19420041 | 0.484281 | 0.00271899 | 17.3181 | 19420042 | -0.000402430 | 0.487402 | 16.8113 |