| Red | Green | Blue | |
| z | 17.64 | ||
| znorm | Inf | ||
| sky | -Inf | -Inf | -Inf |
| S/N | 26.4 | 43.9 | 50.7 |
| S/N(c) | 31.0 | 39.2 | 87.5 |
| SN(E/C) |
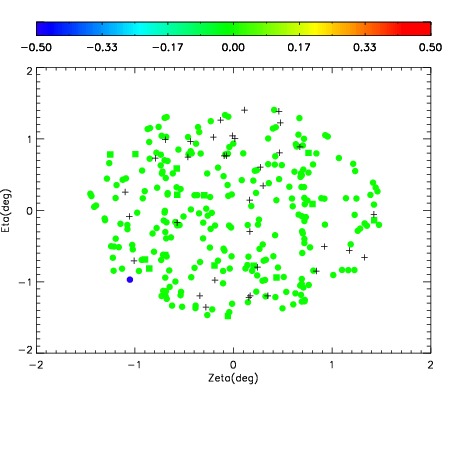
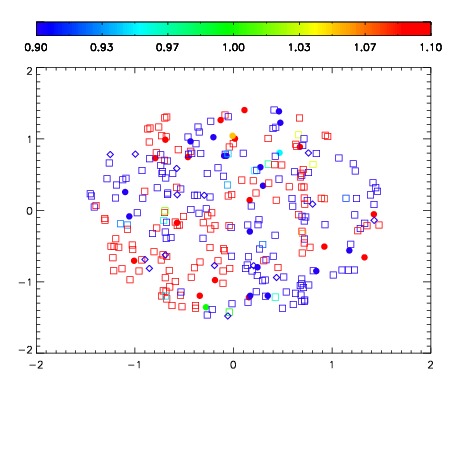
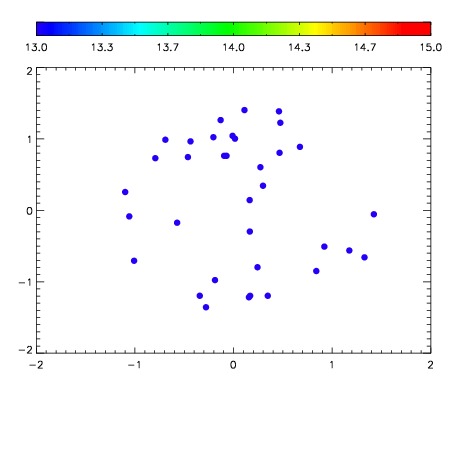

| Frame | Nreads | Zeropoints | Mag plots | Spatial mag deviation | Spatial sky 16325A emission deviations (filled: sky, open: star) | Spatial sky continuum emission | Spatial sky telluric CO2 absorption deviations (filled: H < 10) | |||||||||||||||||||||||
| 0 | 0 |
|
|
|
|
|
|
| IPAIR | NAME | SHIFT | NEWSHIFT | S/N | NAME | SHIFT | NEWSHIFT | S/N |
| 0 | 19450024 | 0.00201267 | 0.00000 | 18.1626 | 19450025 | -0.488179 | 0.490192 | 18.3499 |
| 1 | 19450028 | 0.00125117 | 0.000761500 | 18.7693 | 19450029 | -0.487202 | 0.489215 | 18.7736 |
| 2 | 19450027 | 0.000373720 | 0.00163895 | 18.7491 | 19450026 | -0.488596 | 0.490609 | 18.6383 |
| 3 | 19450020 | 0.00000 | 0.00201267 | 18.6000 | 19450021 | -0.488124 | 0.490137 | 18.3653 |
| 4 | 19450023 | 0.00184763 | 0.000165040 | 17.8916 | 19450022 | -0.488492 | 0.490505 | 17.8170 |