| Red | Green | Blue | |
| z | 17.64 | ||
| znorm | Inf | ||
| sky | -Inf | -Inf | -Inf |
| S/N | 27.4 | 44.5 | 52.1 |
| S/N(c) | 28.8 | 37.0 | 82.2 |
| SN(E/C) |
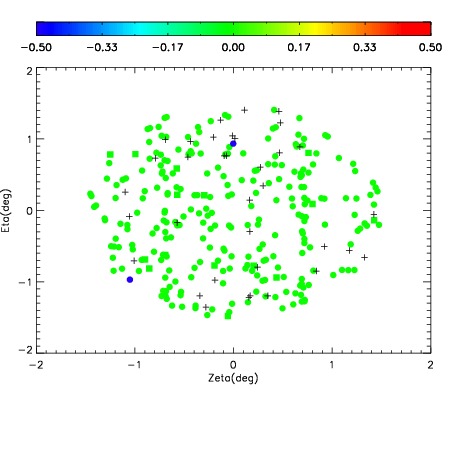
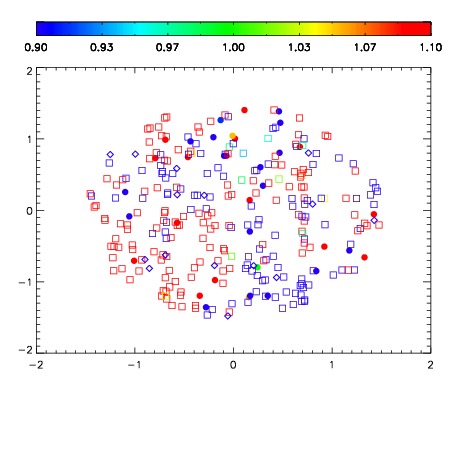
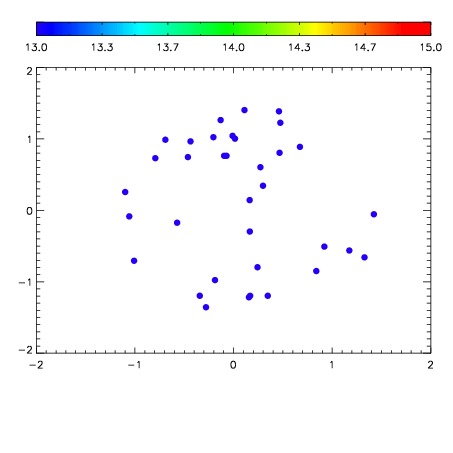

| Frame | Nreads | Zeropoints | Mag plots | Spatial mag deviation | Spatial sky 16325A emission deviations (filled: sky, open: star) | Spatial sky continuum emission | Spatial sky telluric CO2 absorption deviations (filled: H < 10) | |||||||||||||||||||||||
| 0 | 0 |
|
|
|
|
|
|
| IPAIR | NAME | SHIFT | NEWSHIFT | S/N | NAME | SHIFT | NEWSHIFT | S/N |
| 0 | 19590046 | 0.498880 | 0.00000 | 19.0447 | 19590048 | 0.00215093 | 0.496729 | 19.0024 |
| 1 | 19590049 | 0.497874 | 0.00100601 | 19.0134 | 19590047 | 0.00185621 | 0.497024 | 18.9952 |
| 2 | 19590045 | 0.498710 | 0.000169992 | 18.9312 | 19590044 | 0.00000 | 0.498880 | 18.9643 |