| Red | Green | Blue | |
| z | 17.64 | ||
| znorm | Inf | ||
| sky | -Inf | -Inf | -Inf |
| S/N | 35.4 | 51.7 | 65.3 |
| S/N(c) | 35.3 | 44.3 | 99.7 |
| SN(E/C) |
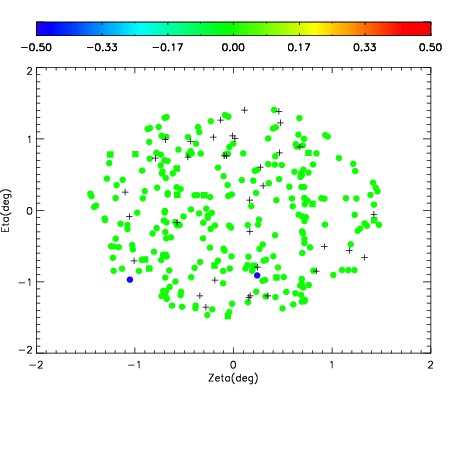
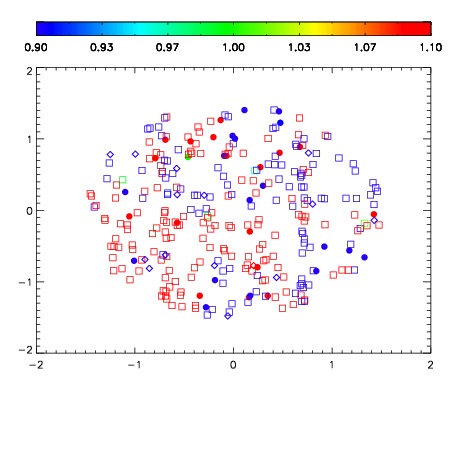
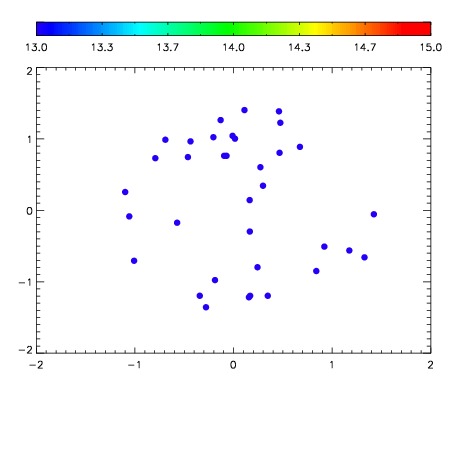

| Frame | Nreads | Zeropoints | Mag plots | Spatial mag deviation | Spatial sky 16325A emission deviations (filled: sky, open: star) | Spatial sky continuum emission | Spatial sky telluric CO2 absorption deviations (filled: H < 10) | |||||||||||||||||||||||
| 0 | 0 |
|
|
|
|
|
|
| IPAIR | NAME | SHIFT | NEWSHIFT | S/N | NAME | SHIFT | NEWSHIFT | S/N |
| 0 | 19660046 | 0.00198100 | 0.00000 | 19.1058 | 19660045 | -0.487301 | 0.489282 | 19.1088 |
| 1 | 19660043 | -0.000998924 | 0.00297992 | 19.0917 | 19660044 | -0.487230 | 0.489211 | 19.0782 |
| 2 | 19660039 | 0.00000 | 0.00198100 | 19.0601 | 19660041 | -0.485794 | 0.487775 | 19.0539 |
| 3 | 19660042 | -0.000670572 | 0.00265157 | 19.0561 | 19660040 | -0.486435 | 0.488416 | 18.9873 |