| Frame | Nreads | Zeropoints | Mag plots
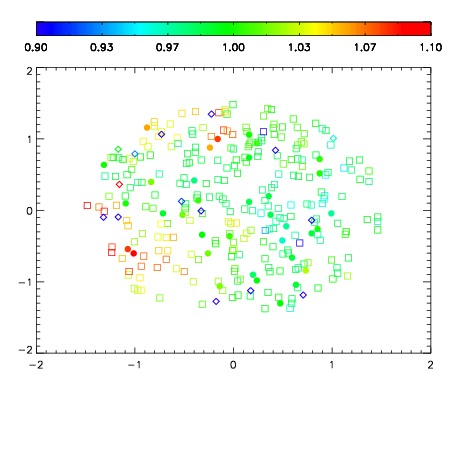
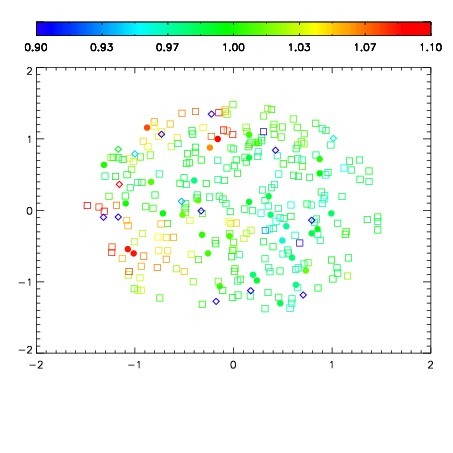
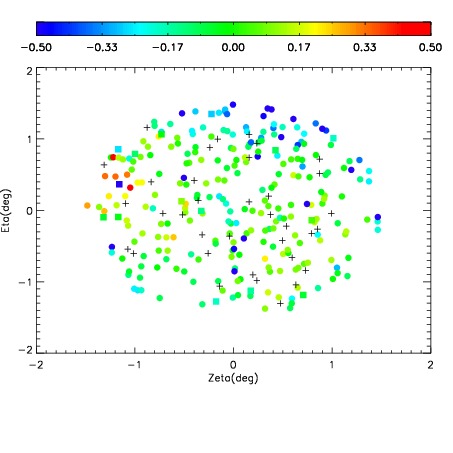
| Spatial mag deviation
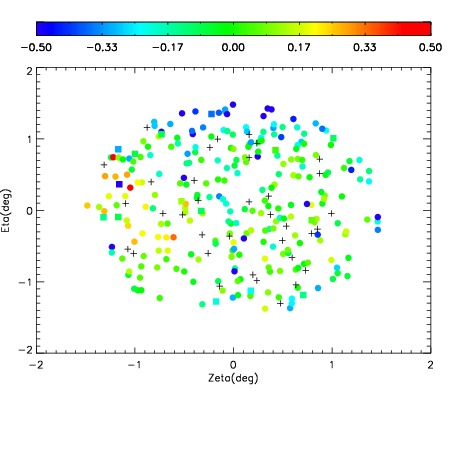
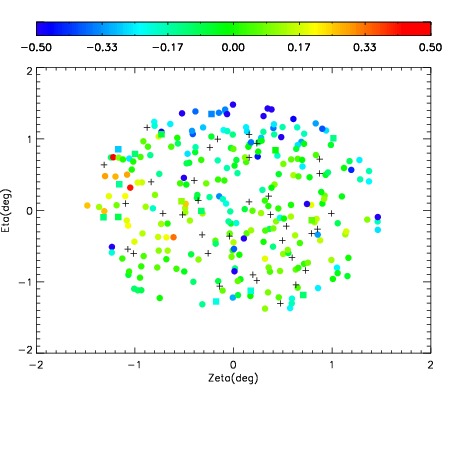
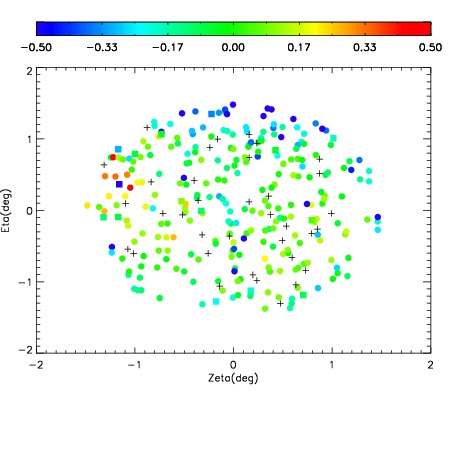
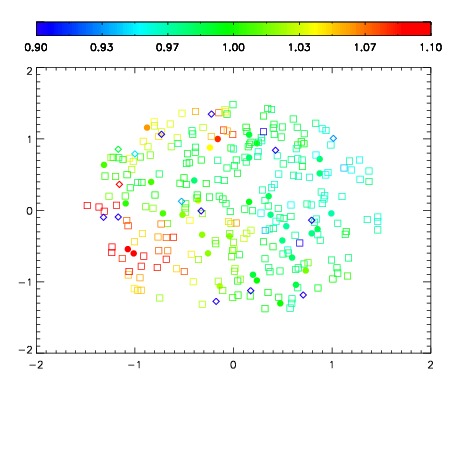
| Spatial sky 16325A emission deviations (filled: sky, open: star)
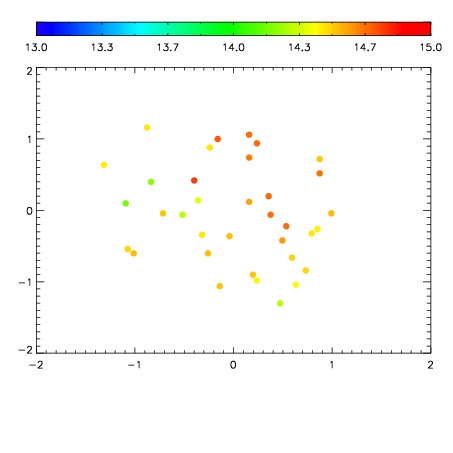
| Spatial sky continuum emission
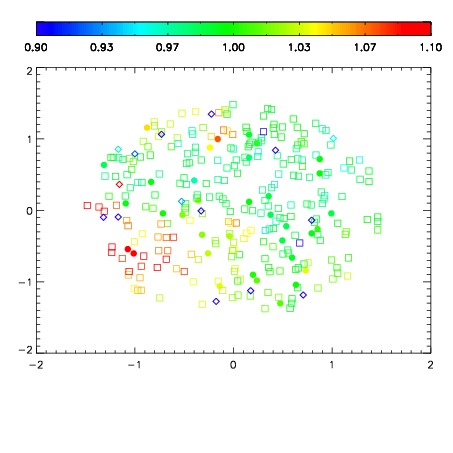
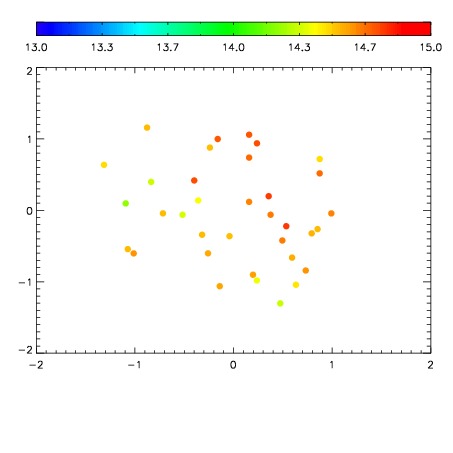
| Spatial sky telluric CO2 absorption deviations (filled: H < 10)
|
| 19410046
| 94
| | Red | Green | Blue
| | z | | 19.67
| | znorm | | 14.74
| | sky | 14.7 | 14.4 | 14.4
| | S/N | 25.3 | 36.1 | 41.2
| | S/N(c) | 24.5 | 5.5 | 8.3
| | SN(E/C) 0.36
|
| 
| 
| 
| 
| 
|
| 19410047
| 94
| | Red | Green | Blue
| | z | | 19.70
| | znorm | | 14.76
| | sky | 14.7 | 14.5 | 14.5
| | S/N | 25.0 | 36.1 | 41.0
| | S/N(c) | 24.7 | 5.8 | 8.3
| | SN(E/C) 0.17
|
| 
| 
| 
| 
| 
|
| 19410048
| 94
| | Red | Green | Blue
| | z | | 19.76
| | znorm | | 14.82
| | sky | 14.8 | 14.5 | 14.5
| | S/N | 25.9 | 37.6 | 42.4
| | S/N(c) | 25.6 | 5.6 | 8.5
| | SN(E/C) 0.35
|
| 
| 
| 
| 
| 
|
| 19410049
| 94
| | Red | Green | Blue
| | z | | 19.79
| | znorm | | 14.86
| | sky | 14.7 | 14.6 | 14.5
| | S/N | 26.1 | 38.1 | 43.1
| | S/N(c) | 25.9 | 5.6 | 8.6
| | SN(E/C) 0.34
|
| 
| 
| 
| 
| 
|