| Red | Green | Blue | |
| z | 17.64 | ||
| znorm | Inf | ||
| sky | -Inf | -Inf | -NaN |
| S/N | 41.8 | 62.7 | 74.0 |
| S/N(c) | 29.0 | 28.2 | 103.4 |
| SN(E/C) |
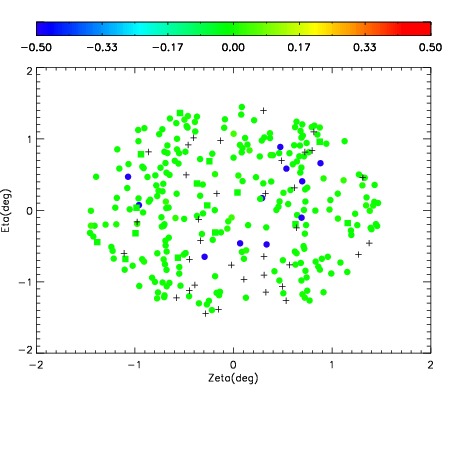
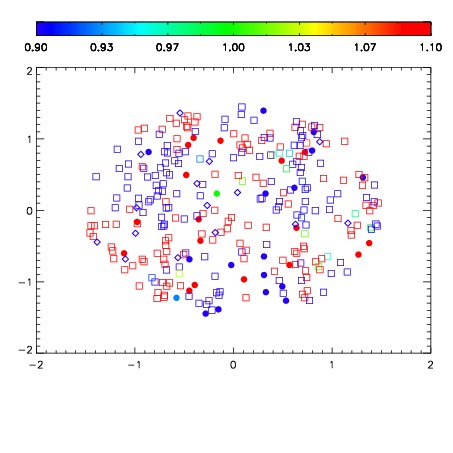


| Frame | Nreads | Zeropoints | Mag plots | Spatial mag deviation | Spatial sky 16325A emission deviations (filled: sky, open: star) | Spatial sky continuum emission | Spatial sky telluric CO2 absorption deviations (filled: H < 10) | |||||||||||||||||||||||
| 0 | 0 |
|
|
|
|
|
|
| IPAIR | NAME | SHIFT | NEWSHIFT | S/N | NAME | SHIFT | NEWSHIFT | S/N |
| 0 | 19060063 | 0.00305209 | 0.00000 | 19.0538 | 19060061 | -0.500755 | 0.503807 | 19.0454 |
| 1 | 19060062 | 0.00277308 | 0.000279010 | 19.0763 | 19060064 | -0.501538 | 0.504590 | 19.0680 |
| 2 | 19060059 | 0.00000 | 0.00305209 | 19.0675 | 19060060 | -0.500770 | 0.503822 | 19.0629 |
| 3 | 19060066 | 0.00150626 | 0.00154583 | 19.0250 | 19060065 | -0.501809 | 0.504861 | 19.0243 |