| Red | Green | Blue | |
| z | 17.64 | ||
| znorm | Inf | ||
| sky | -Inf | -Inf | -Inf |
| S/N | 36.4 | 56.8 | 64.0 |
| S/N(c) | 21.9 | 23.8 | 78.4 |
| SN(E/C) |
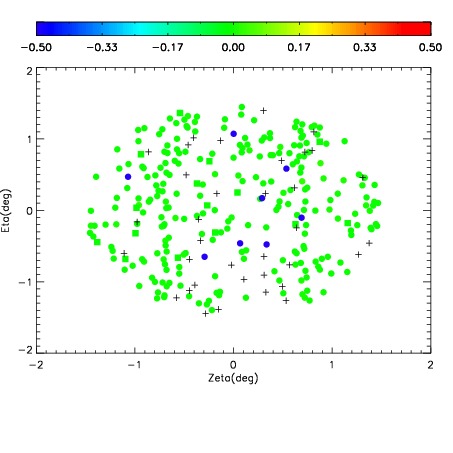
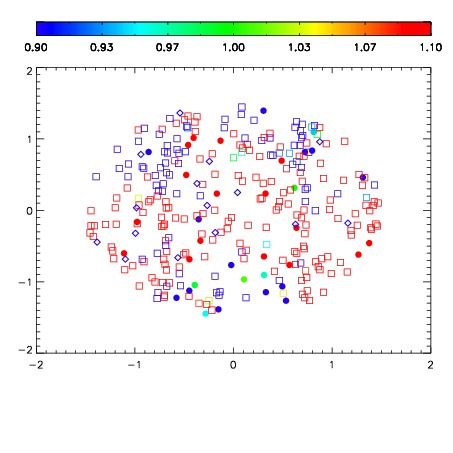
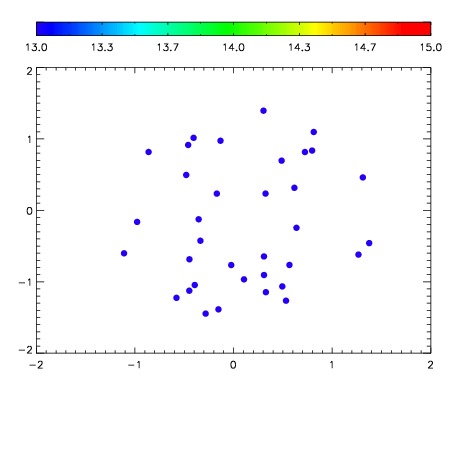

| Frame | Nreads | Zeropoints | Mag plots | Spatial mag deviation | Spatial sky 16325A emission deviations (filled: sky, open: star) | Spatial sky continuum emission | Spatial sky telluric CO2 absorption deviations (filled: H < 10) | |||||||||||||||||||||||
| 0 | 0 |
|
|
|
|
|
|
| IPAIR | NAME | SHIFT | NEWSHIFT | S/N | NAME | SHIFT | NEWSHIFT | S/N |
| 0 | 19120071 | 0.000891476 | 0.00000 | 18.7190 | 19120069 | -0.496890 | 0.497781 | 18.7547 |
| 1 | 19120074 | -0.000265422 | 0.00115690 | 18.8188 | 19120073 | -0.496625 | 0.497516 | 18.8212 |
| 2 | 19120067 | 0.00000 | 0.000891476 | 18.7710 | 19120072 | -0.496605 | 0.497496 | 18.7822 |
| 3 | 19120070 | 0.000132700 | 0.000758776 | 18.7326 | 19120068 | -0.496499 | 0.497390 | 18.7708 |