| Red | Green | Blue | |
| z | 17.64 | ||
| znorm | Inf | ||
| sky | -Inf | -Inf | -NaN |
| S/N | 38.4 | 57.7 | 67.0 |
| S/N(c) | 26.7 | 72.4 | 95.8 |
| SN(E/C) |
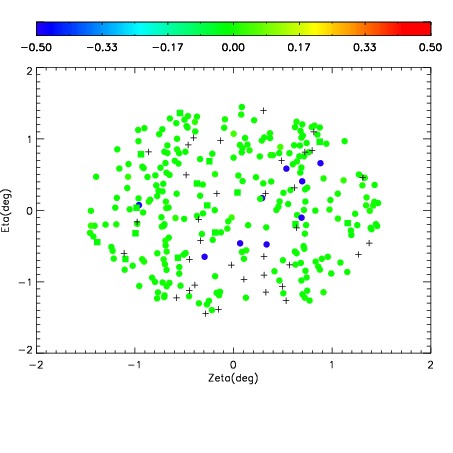
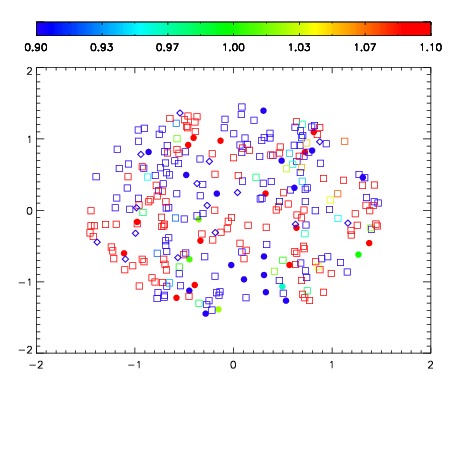
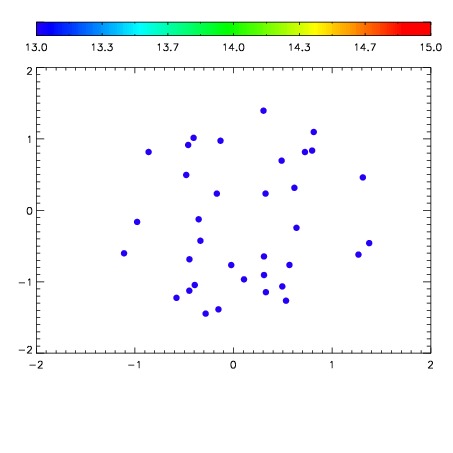

| Frame | Nreads | Zeropoints | Mag plots | Spatial mag deviation | Spatial sky 16325A emission deviations (filled: sky, open: star) | Spatial sky continuum emission | Spatial sky telluric CO2 absorption deviations (filled: H < 10) | |||||||||||||||||||||||
| 0 | 0 |
|
|
|
|
|
|
| IPAIR | NAME | SHIFT | NEWSHIFT | S/N | NAME | SHIFT | NEWSHIFT | S/N |
| 0 | 19380060 | 0.491001 | 0.00000 | 18.8604 | 19380065 | 0.00331016 | 0.487691 | 18.8161 |
| 1 | 19380059 | 0.490615 | 0.000386000 | 18.9549 | 19380062 | 0.000564789 | 0.490436 | 18.9079 |
| 2 | 19380063 | 0.489925 | 0.00107601 | 18.8843 | 19380061 | 0.000359522 | 0.490641 | 18.8983 |
| 3 | 19380064 | 0.490010 | 0.000991017 | 18.8758 | 19380058 | 0.00000 | 0.491001 | 18.8757 |