| Red | Green | Blue | |
| z | 17.64 | ||
| znorm | Inf | ||
| sky | -Inf | -Inf | -NaN |
| S/N | 34.8 | 52.1 | 60.5 |
| S/N(c) | 22.0 | 66.9 | 81.7 |
| SN(E/C) |
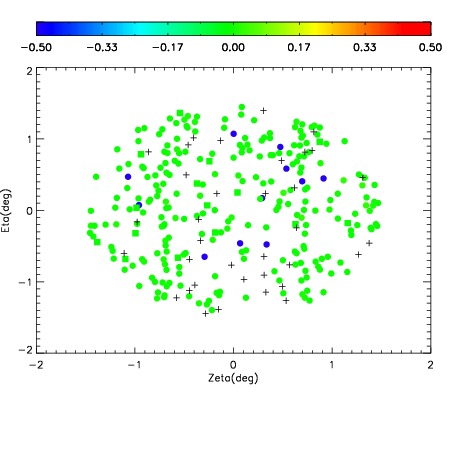
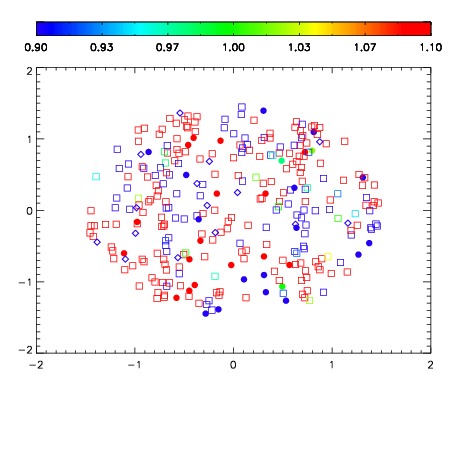
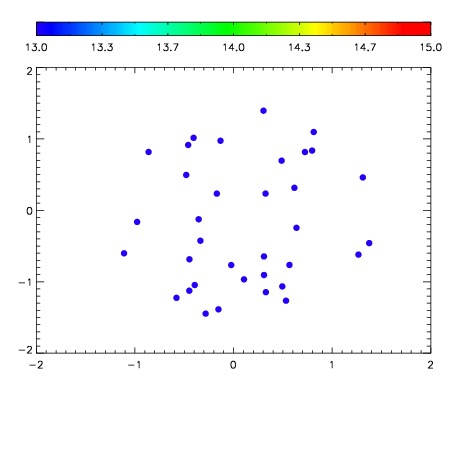

| Frame | Nreads | Zeropoints | Mag plots | Spatial mag deviation | Spatial sky 16325A emission deviations (filled: sky, open: star) | Spatial sky continuum emission | Spatial sky telluric CO2 absorption deviations (filled: H < 10) | |||||||||||||||||||||||
| 0 | 0 |
|
|
|
|
|
|
| IPAIR | NAME | SHIFT | NEWSHIFT | S/N | NAME | SHIFT | NEWSHIFT | S/N |
| 0 | 19440050 | 0.00000 | 0.00000 | 18.8945 | 19440055 | -0.482029 | 0.482029 | 18.4882 |
| 1 | 19440053 | -0.00118291 | 0.00118291 | 18.9940 | 19440051 | -0.482514 | 0.482514 | 18.9431 |
| 2 | 19440054 | -0.000526567 | 0.000526567 | 18.9196 | 19440052 | -0.482294 | 0.482294 | 18.9426 |
| 3 | 19440057 | -0.00161577 | 0.00161577 | 18.4607 | 19440056 | -0.481643 | 0.481643 | 18.1945 |