| Red | Green | Blue | |
| z | 17.64 | ||
| znorm | Inf | ||
| sky | -Inf | -Inf | -Inf |
| S/N | 22.7 | 34.6 | 39.9 |
| S/N(c) | 32.0 | 22.0 | 56.6 |
| SN(E/C) |
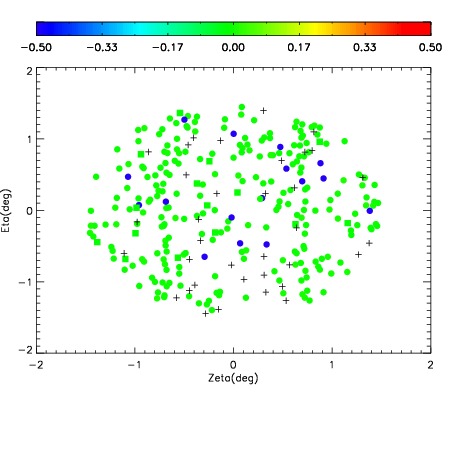

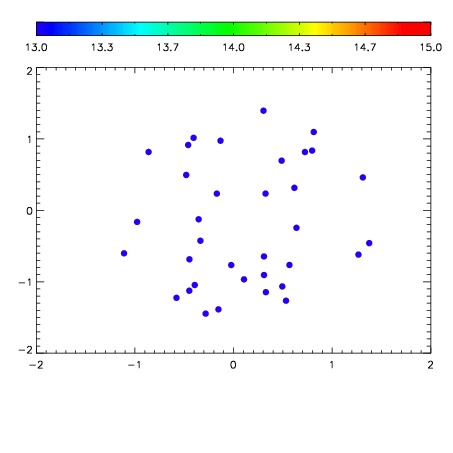

| Frame | Nreads | Zeropoints | Mag plots | Spatial mag deviation | Spatial sky 16325A emission deviations (filled: sky, open: star) | Spatial sky continuum emission | Spatial sky telluric CO2 absorption deviations (filled: H < 10) | |||||||||||||||||||||||
| 0 | 0 |
|
|
|
|
|
|
| IPAIR | NAME | SHIFT | NEWSHIFT | S/N | NAME | SHIFT | NEWSHIFT | S/N |
| 0 | 19620042 | 0.495351 | 0.00000 | 18.6991 | 19620043 | 0.00101789 | 0.494333 | 18.5489 |
| 1 | 19620041 | 0.494593 | 0.000757992 | 18.7167 | 19620040 | 0.00000 | 0.495351 | 18.6390 |