| Red | Green | Blue | |
| z | 17.64 | ||
| znorm | Inf | ||
| sky | -Inf | -Inf | -NaN |
| S/N | 39.1 | 59.6 | 68.7 |
| S/N(c) | 41.1 | 0.5 | 65.5 |
| SN(E/C) |
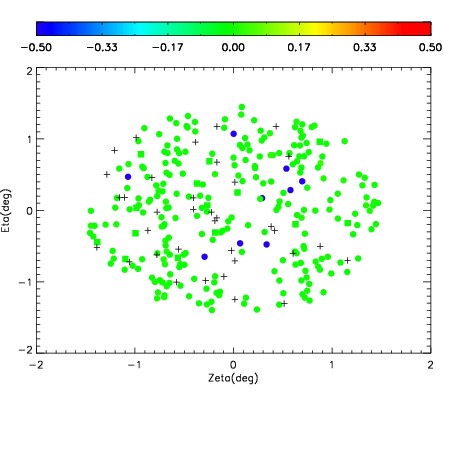
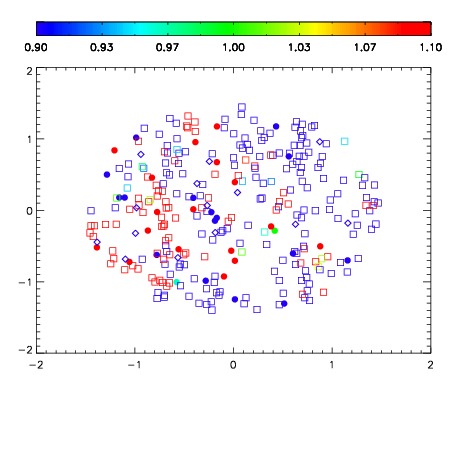
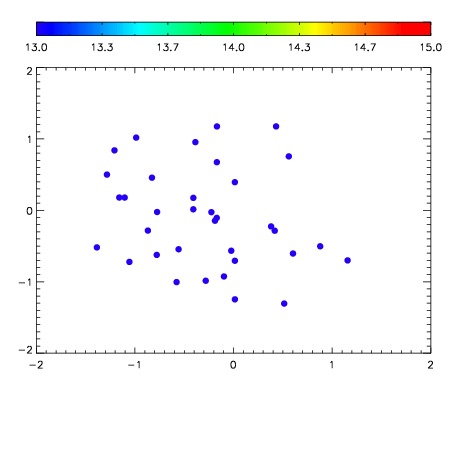

| Frame | Nreads | Zeropoints | Mag plots | Spatial mag deviation | Spatial sky 16325A emission deviations (filled: sky, open: star) | Spatial sky continuum emission | Spatial sky telluric CO2 absorption deviations (filled: H < 10) | |||||||||||||||||||||||
| 0 | 0 |
|
|
|
|
|
|
| IPAIR | NAME | SHIFT | NEWSHIFT | S/N | NAME | SHIFT | NEWSHIFT | S/N |
| 0 | 19140079 | 0.503486 | 0.00000 | 18.7059 | 19140077 | -0.00237255 | 0.505859 | 18.6673 |
| 1 | 19140071 | 0.501448 | 0.00203800 | 18.8945 | 19140070 | 0.00000 | 0.503486 | 18.8859 |
| 2 | 19140072 | 0.501585 | 0.00190097 | 18.7818 | 19140074 | -0.000923031 | 0.504409 | 18.7768 |
| 3 | 19140075 | 0.502115 | 0.00137097 | 18.7411 | 19140073 | -0.000692681 | 0.504179 | 18.7192 |
| 4 | 19140076 | 0.502878 | 0.000607967 | 18.6623 | 19140078 | -0.00185013 | 0.505336 | 18.5926 |