| Red | Green | Blue | |
| z | 17.64 | ||
| znorm | Inf | ||
| sky | -Inf | -Inf | -NaN |
| S/N | 35.2 | 53.3 | 62.2 |
| S/N(c) | 50.2 | 80.6 | 84.6 |
| SN(E/C) |
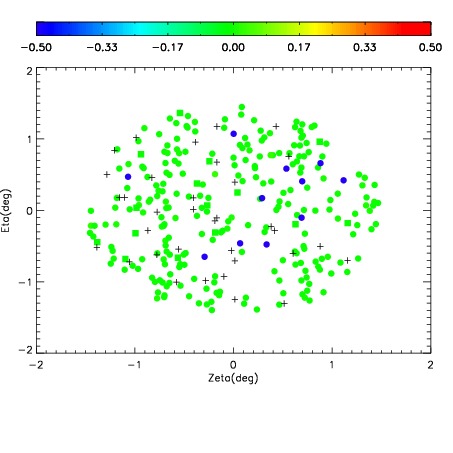
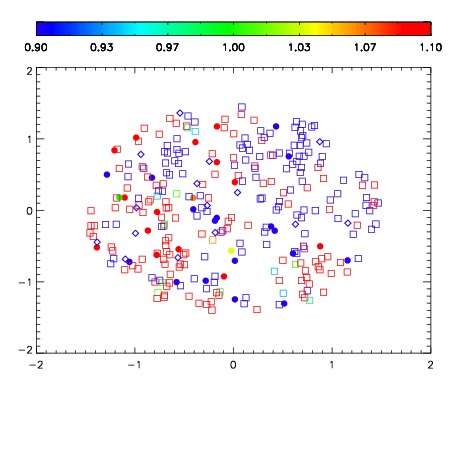
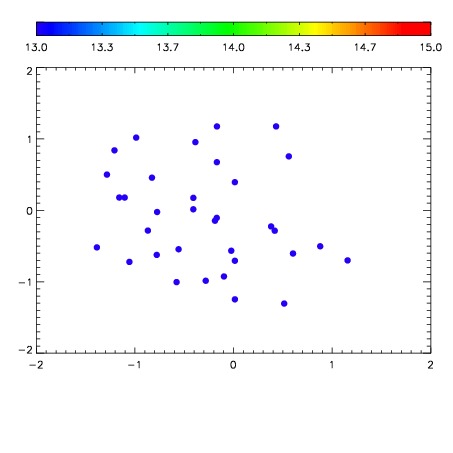

| Frame | Nreads | Zeropoints | Mag plots | Spatial mag deviation | Spatial sky 16325A emission deviations (filled: sky, open: star) | Spatial sky continuum emission | Spatial sky telluric CO2 absorption deviations (filled: H < 10) | |||||||||||||||||||||||
| 0 | 0 |
|
|
|
|
|
|
| IPAIR | NAME | SHIFT | NEWSHIFT | S/N | NAME | SHIFT | NEWSHIFT | S/N |
| 0 | 19700039 | 0.00278027 | 0.00000 | 18.8338 | 19700041 | -0.485147 | 0.487927 | 18.9356 |
| 1 | 19700042 | 0.00133988 | 0.00144039 | 18.9651 | 19700037 | -0.485548 | 0.488328 | 18.9704 |
| 2 | 19700035 | 0.00000 | 0.00278027 | 18.9369 | 19700040 | -0.485339 | 0.488119 | 18.9654 |
| 3 | 19700038 | 0.00206421 | 0.000716060 | 18.9195 | 19700036 | -0.485241 | 0.488021 | 18.9583 |