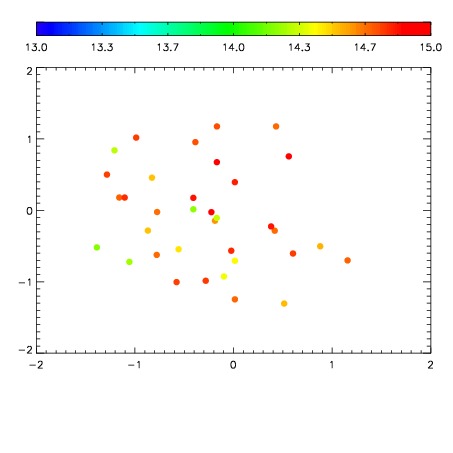
| Frame | Nreads | Zeropoints | Mag plots
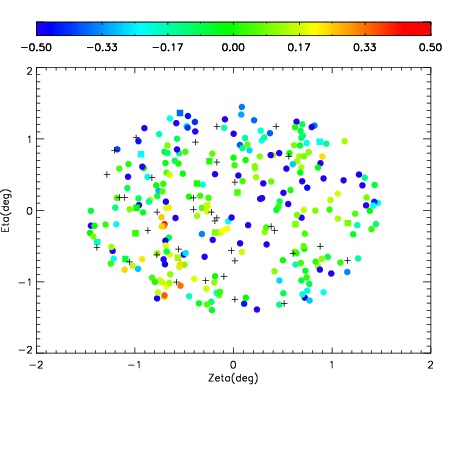
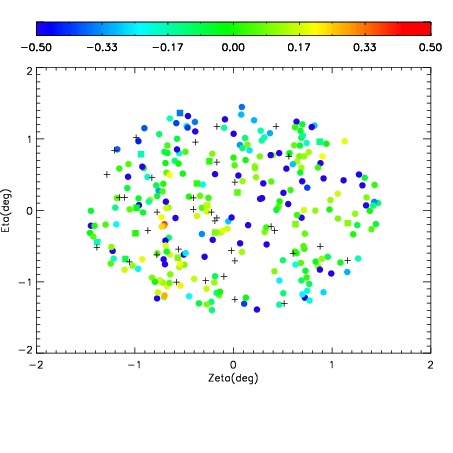
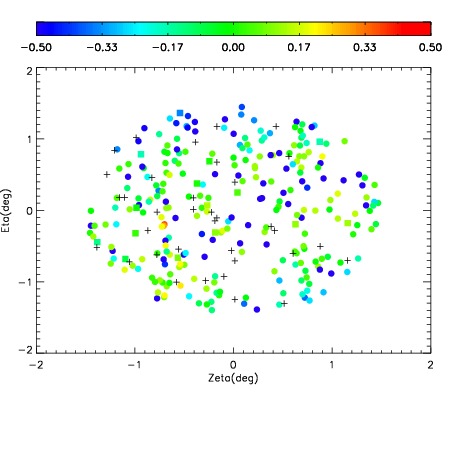
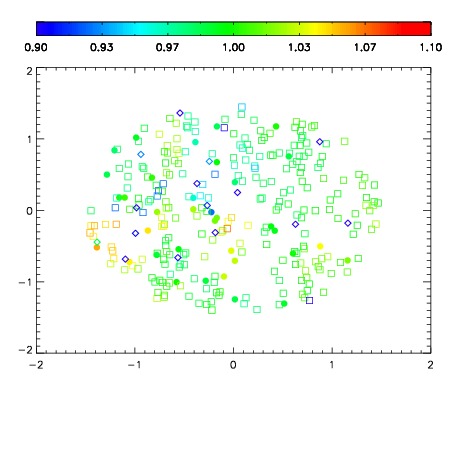
| Spatial mag deviation
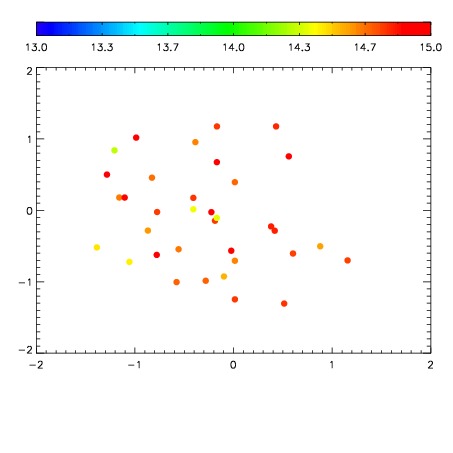
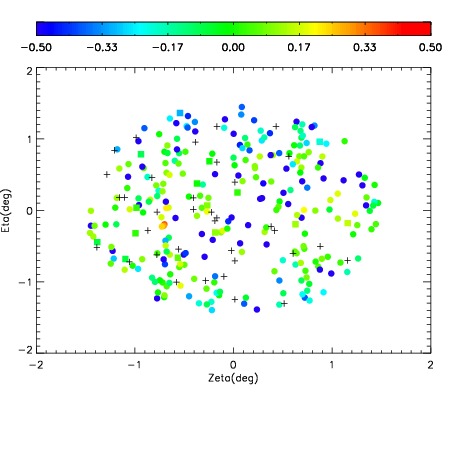
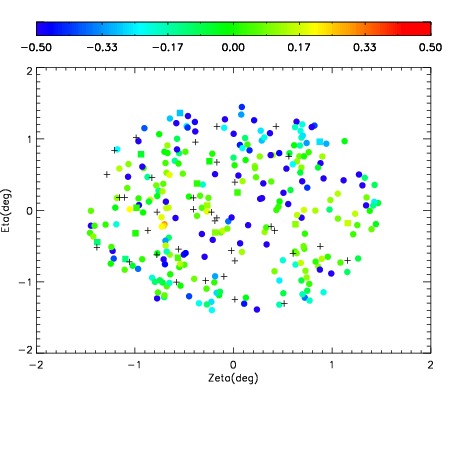
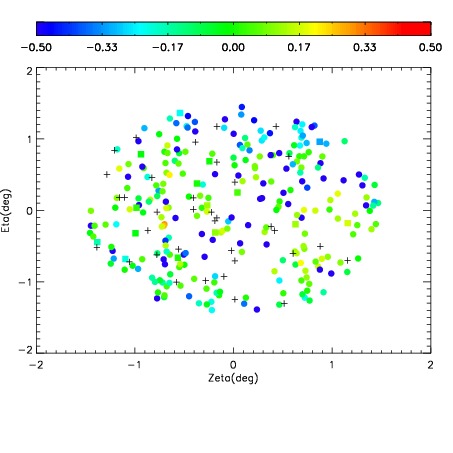
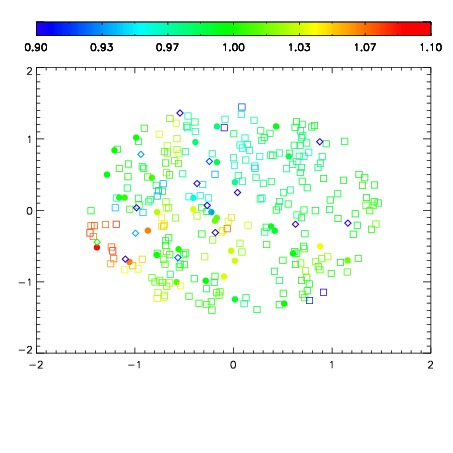
| Spatial sky 16325A emission deviations (filled: sky, open: star)
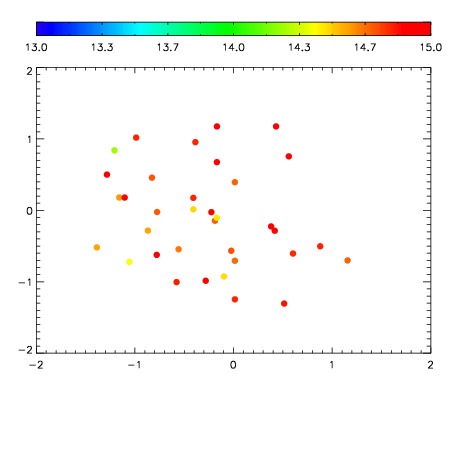
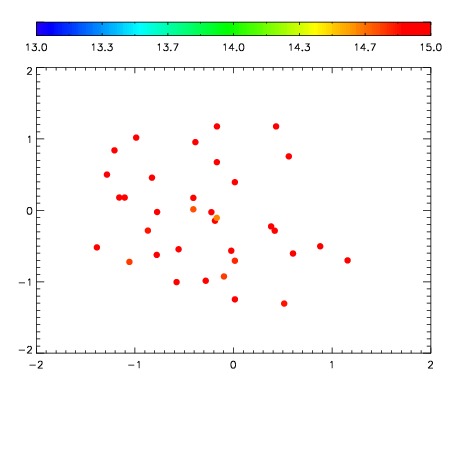
| Spatial sky continuum emission
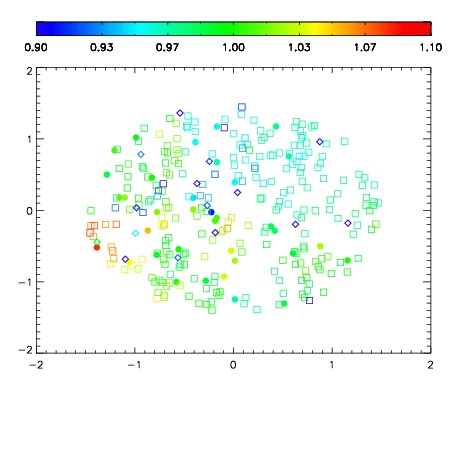
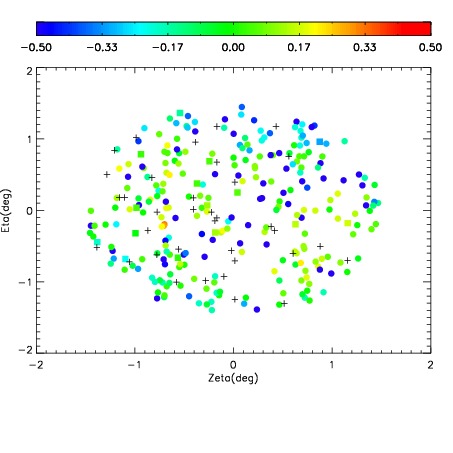
| Spatial sky telluric CO2 absorption deviations (filled: H < 10)
|
| 19730034
| 47
| | Red | Green | Blue
| | z | | 19.06
| | znorm | | 14.88
| | sky | 14.9 | 14.7 | 14.8
| | S/N | 21.4 | 30.5 | 35.8
| | S/N(c) | 12.9 | 37.4 | 46.7
| | SN(E/C) 0.44
|
| 
| 
| 
| 
| 
|
| 19730035
| 47
| | Red | Green | Blue
| | z | | 19.08
| | znorm | | 14.90
| | sky | 15.2 | 14.8 | 15.1
| | S/N | 21.5 | 30.5 | 35.7
| | S/N(c) | 12.8 | 37.8 | 47.2
| | SN(E/C) 0.40
|
| 
| 
| 
| 
| 
|
| 19730036
| 47
| | Red | Green | Blue
| | z | | 19.04
| | znorm | | 14.86
| | sky | 14.9 | 14.9 | 14.8
| | S/N | 21.3 | 30.3 | 35.3
| | S/N(c) | 12.5 | 37.4 | 46.9
| | SN(E/C) 0.44
|
| 
| 
| 
| 
| 
|
| 19730037
| 47
| | Red | Green | Blue
| | z | | 19.05
| | znorm | | 14.87
| | sky | 14.8 | 14.8 | 14.9
| | S/N | 21.5 | 30.6 | 35.6
| | S/N(c) | 12.6 | 37.4 | 47.3
| | SN(E/C) 0.41
|
| 
| 
| 
| 
| 
|
| 19730038
| 47
| | Red | Green | Blue
| | z | | 18.97
| | znorm | | 14.79
| | sky | 15.3 | 15.0 | 15.0
| | S/N | 20.8 | 29.8 | 34.5
| | S/N(c) | 12.3 | 36.1 | 45.8
| | SN(E/C) 0.44
|
| 
| 
| 
| 
| 
|
| 19730039
| 47
| | Red | Green | Blue
| | z | | 19.03
| | znorm | | 14.85
| | sky | 15.3 | 15.2 | 15.0
| | S/N | 21.5 | 30.7 | 35.5
| | S/N(c) | 12.7 | 37.1 | 47.4
| | SN(E/C) 0.42
|
| 
| 
| 
| 
| 
|
| 19730040
| 47
| | Red | Green | Blue
| | z | | 19.02
| | znorm | | 14.84
| | sky | 15.0 | 15.0 | 15.0
| | S/N | 21.4 | 30.4 | 35.1
| | S/N(c) | 12.7 | 36.2 | 46.3
| | SN(E/C) 0.43
|
| 
| 
| 
| 
| 
|
| 19730041
| 47
| | Red | Green | Blue
| | z | | 18.94
| | znorm | | 14.76
| | sky | 15.2 | 15.1 | 15.0
| | S/N | 20.7 | 29.7 | 33.9
| | S/N(c) | 12.2 | 35.0 | 44.8
| | SN(E/C) 0.41
|
| 
| 
| 
| 
| 
|