| Red | Green | Blue | |
| z | 17.64 | ||
| znorm | Inf | ||
| sky | -Inf | -Inf | -NaN |
| S/N | 40.3 | 59.4 | 69.1 |
| S/N(c) | 25.0 | 73.5 | 93.6 |
| SN(E/C) |
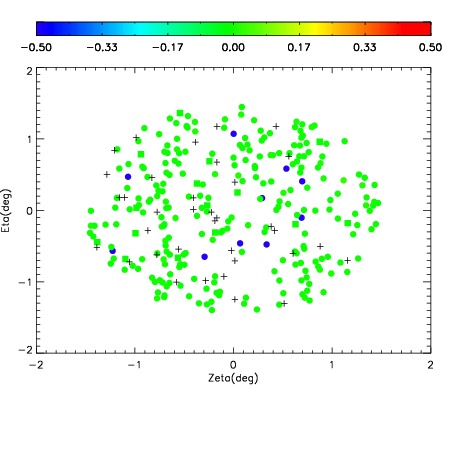
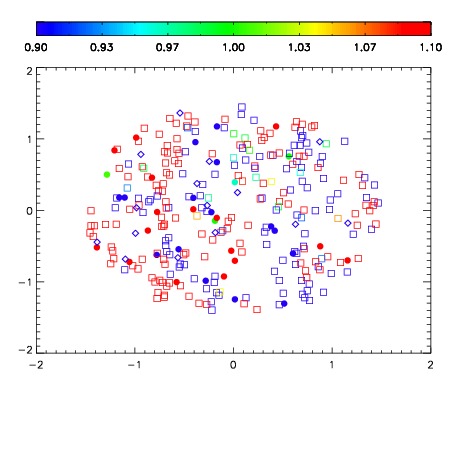
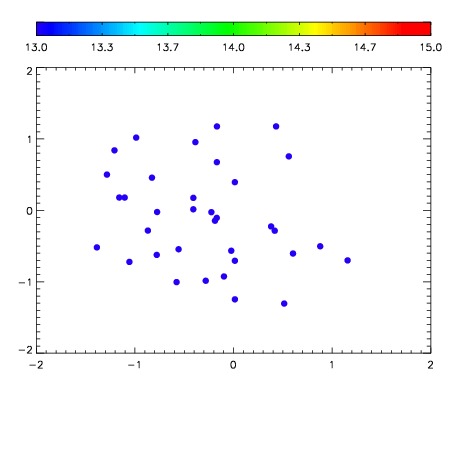

| Frame | Nreads | Zeropoints | Mag plots | Spatial mag deviation | Spatial sky 16325A emission deviations (filled: sky, open: star) | Spatial sky continuum emission | Spatial sky telluric CO2 absorption deviations (filled: H < 10) | |||||||||||||||||||||||
| 0 | 0 |
|
|
|
|
|
|
| IPAIR | NAME | SHIFT | NEWSHIFT | S/N | NAME | SHIFT | NEWSHIFT | S/N |
| 0 | 19730036 | 0.491414 | 0.00000 | 19.0229 | 19730034 | 0.00000 | 0.491414 | 19.0265 |
| 1 | 19730035 | 0.491113 | 0.000301003 | 19.0426 | 19730037 | 0.00166412 | 0.489750 | 19.0324 |
| 2 | 19730040 | 0.489970 | 0.00144401 | 18.9868 | 19730038 | 0.00157691 | 0.489837 | 18.9515 |
| 3 | 19730039 | 0.489075 | 0.00233901 | 18.9771 | 19730041 | -0.00147166 | 0.492886 | 18.9078 |