| Red | Green | Blue | |
| z | 17.64 | ||
| znorm | Inf | ||
| sky | -Inf | -NaN | -NaN |
| S/N | 40.6 | 60.9 | 71.5 |
| S/N(c) | 55.8 | 82.8 | 45.5 |
| SN(E/C) |
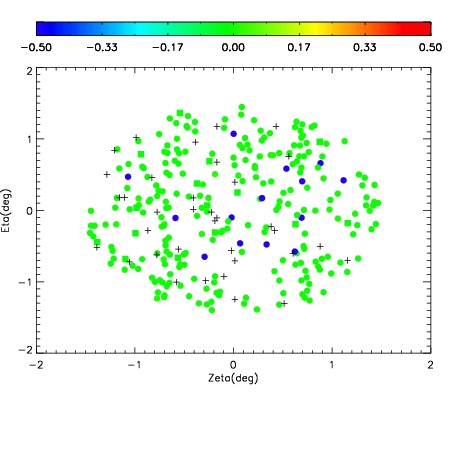
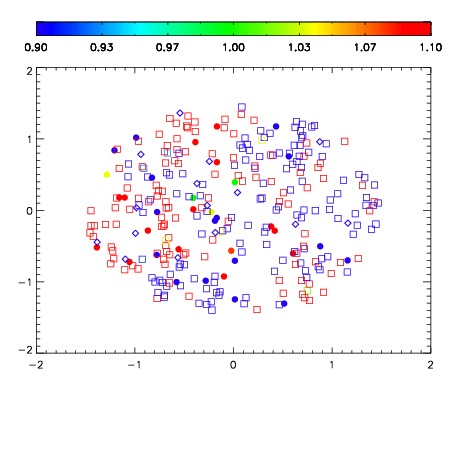
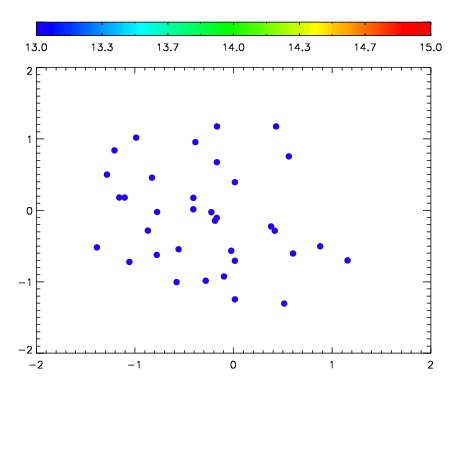

| Frame | Nreads | Zeropoints | Mag plots | Spatial mag deviation | Spatial sky 16325A emission deviations (filled: sky, open: star) | Spatial sky continuum emission | Spatial sky telluric CO2 absorption deviations (filled: H < 10) | |||||||||||||||||||||||
| 0 | 0 |
|
|
|
|
|
|
| IPAIR | NAME | SHIFT | NEWSHIFT | S/N | NAME | SHIFT | NEWSHIFT | S/N |
| 0 | 19900027 | 0.496906 | 0.00000 | 19.0469 | 19900024 | 0.000410978 | 0.496495 | 19.0720 |
| 1 | 19900022 | 0.495208 | 0.00169802 | 19.0417 | 19900025 | 0.000570727 | 0.496335 | 19.0318 |
| 2 | 19900023 | 0.495196 | 0.00171000 | 19.0256 | 19900028 | -0.000575887 | 0.497482 | 19.0235 |
| 3 | 19900026 | 0.495614 | 0.00129202 | 19.0184 | 19900021 | 0.00000 | 0.496906 | 18.9823 |