| Red | Green | Blue | |
| z | 17.64 | ||
| znorm | Inf | ||
| sky | -Inf | -Inf | -Inf |
| S/N | 25.0 | 38.2 | 44.1 |
| S/N(c) | 37.8 | 23.4 | 57.6 |
| SN(E/C) |
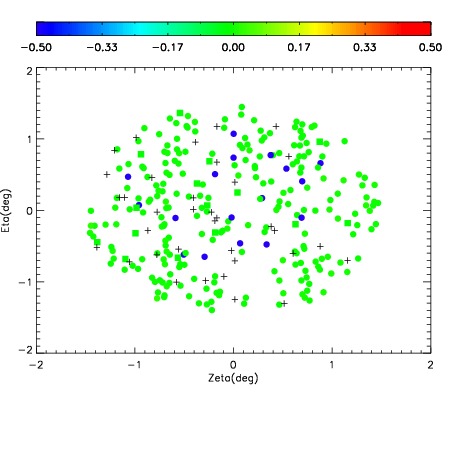
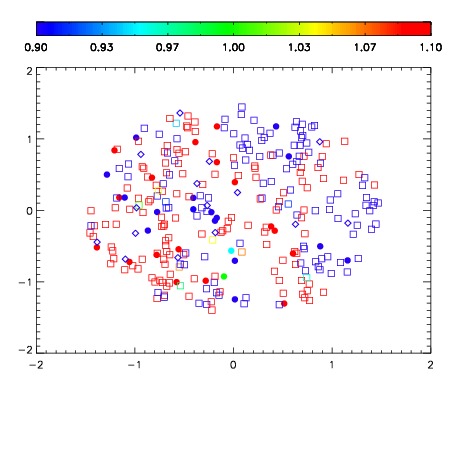
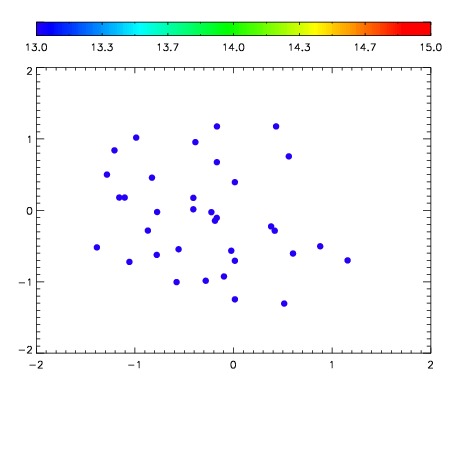

| Frame | Nreads | Zeropoints | Mag plots | Spatial mag deviation | Spatial sky 16325A emission deviations (filled: sky, open: star) | Spatial sky continuum emission | Spatial sky telluric CO2 absorption deviations (filled: H < 10) | |||||||||||||||||||||||
| 0 | 0 |
|
|
|
|
|
|
| IPAIR | NAME | SHIFT | NEWSHIFT | S/N | NAME | SHIFT | NEWSHIFT | S/N |
| 0 | 19930020 | 0.498930 | 0.00000 | 18.9096 | 19930018 | 0.00000 | 0.498930 | 18.9146 |
| 1 | 19930019 | 0.497520 | 0.00141001 | 18.9288 | 19930021 | 0.000988347 | 0.497942 | 18.9231 |