| Red | Green | Blue | |
| z | 17.65 | ||
| znorm | Inf | ||
| sky | -Inf | -Inf | -Inf |
| S/N | 20.5 | 31.9 | 36.5 |
| S/N(c) | 13.2 | 18.8 | 17.7 |
| SN(E/C) |
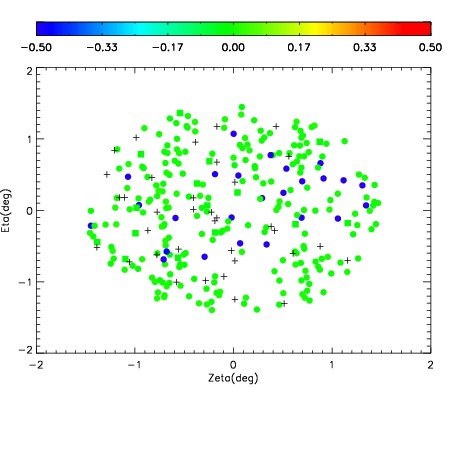
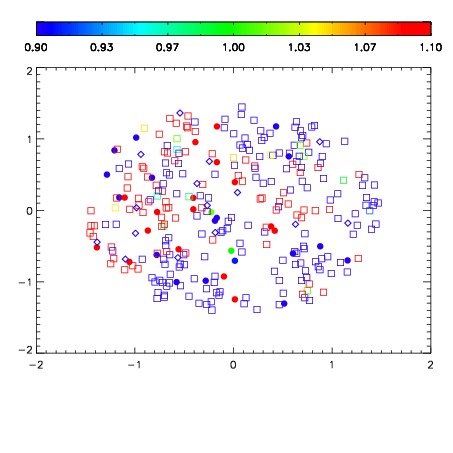
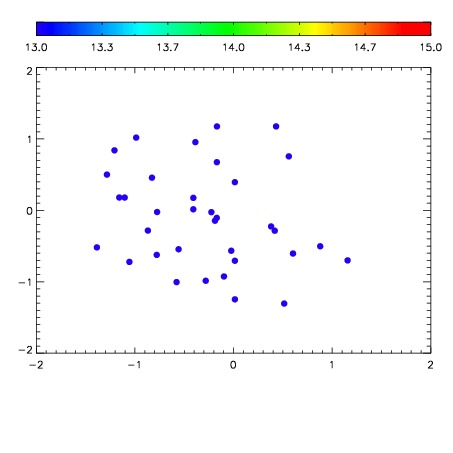

| Frame | Nreads | Zeropoints | Mag plots | Spatial mag deviation | Spatial sky 16325A emission deviations (filled: sky, open: star) | Spatial sky continuum emission | Spatial sky telluric CO2 absorption deviations (filled: H < 10) | |||||||||||||||||||||||
| 0 | 0 |
|
|
|
|
|
|
| IPAIR | NAME | SHIFT | NEWSHIFT | S/N | NAME | SHIFT | NEWSHIFT | S/N |
| 0 | 19960027 | 0.504438 | 0.00000 | 18.4533 | 19960025 | 0.00000 | 0.504438 | 18.4685 |
| 1 | 19960026 | 0.503712 | 0.000725985 | 18.4903 | 19960028 | 0.00828443 | 0.496154 | 18.5156 |