| Red | Green | Blue | |
| z | 17.64 | ||
| znorm | Inf | ||
| sky | -Inf | -Inf | -NaN |
| S/N | 40.4 | 59.2 | 70.4 |
| S/N(c) | 0.0 | 0.0 | 0.0 |
| SN(E/C) |
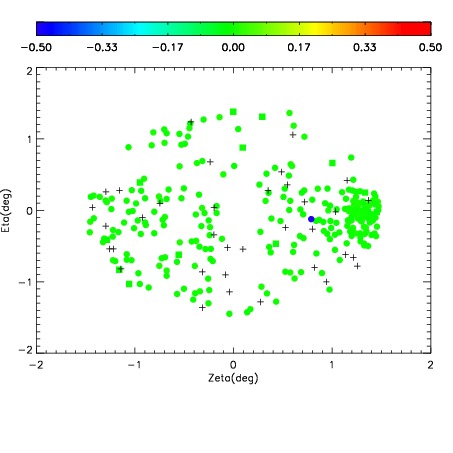
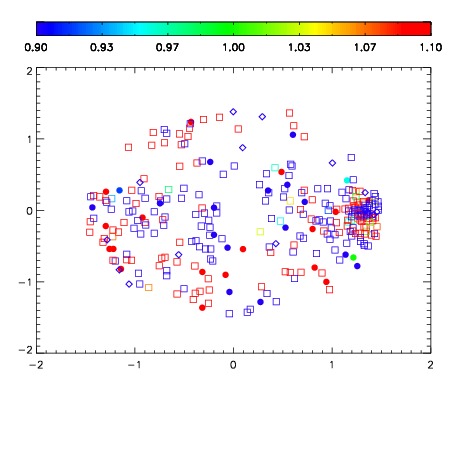
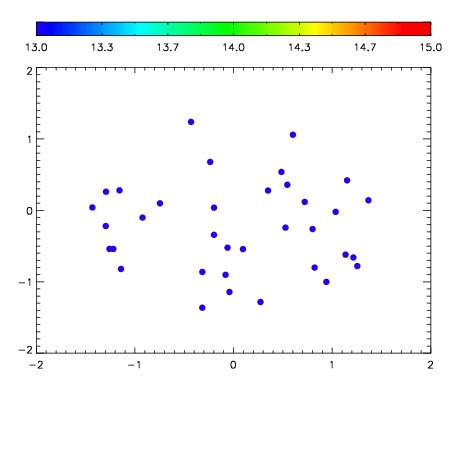

| Frame | Nreads | Zeropoints | Mag plots | Spatial mag deviation | Spatial sky 16325A emission deviations (filled: sky, open: star) | Spatial sky continuum emission | Spatial sky telluric CO2 absorption deviations (filled: H < 10) | |||||||||||||||||||||||
| 0 | 0 |
|
|
|
|
|
|
| IPAIR | NAME | SHIFT | NEWSHIFT | S/N | NAME | SHIFT | NEWSHIFT | S/N |
| 0 | 19060024 | 0.00236221 | 0.00000 | 19.7808 | 19060022 | -0.499915 | 0.502277 | 19.8223 |
| 1 | 19060023 | 0.00138065 | 0.000981560 | 19.7970 | 19060021 | -0.500015 | 0.502377 | 19.8566 |
| 2 | 19060020 | 0.00000 | 0.00236221 | 19.7496 | 19060025 | -0.498445 | 0.500807 | 19.7645 |