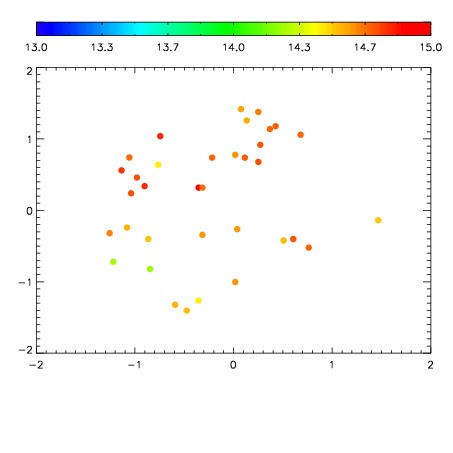
| Frame | Nreads | Zeropoints | Mag plots
| Spatial mag deviation
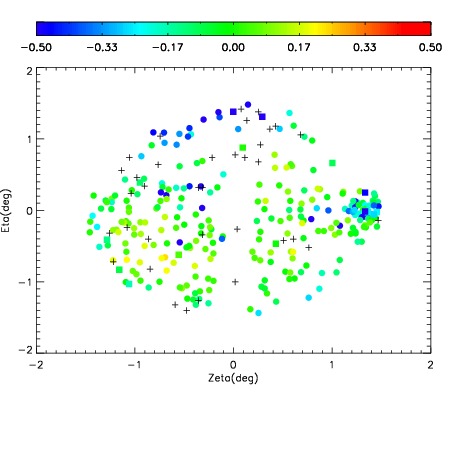
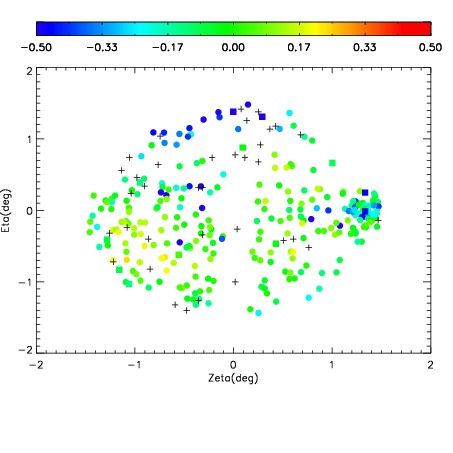
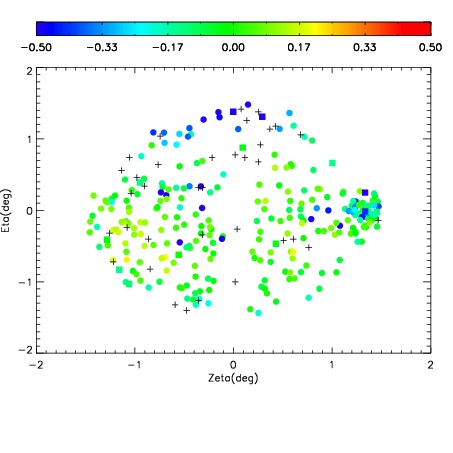
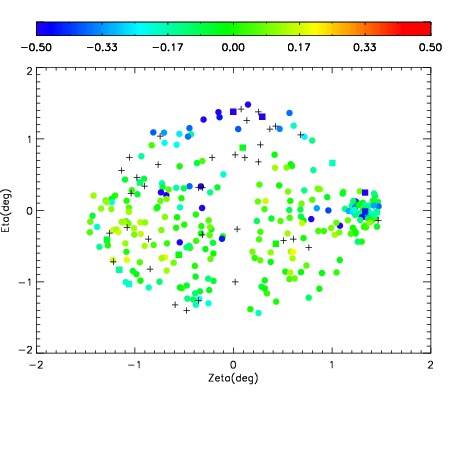
| Spatial sky 16325A emission deviations (filled: sky, open: star)
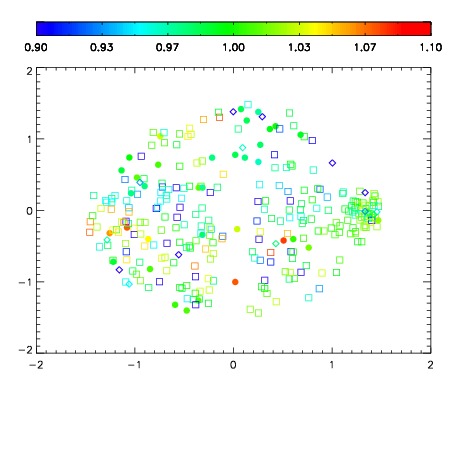
| Spatial sky continuum emission
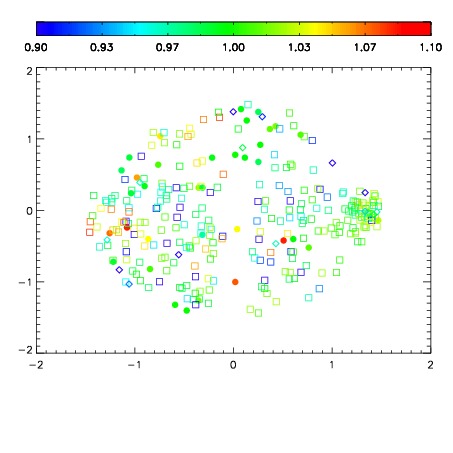
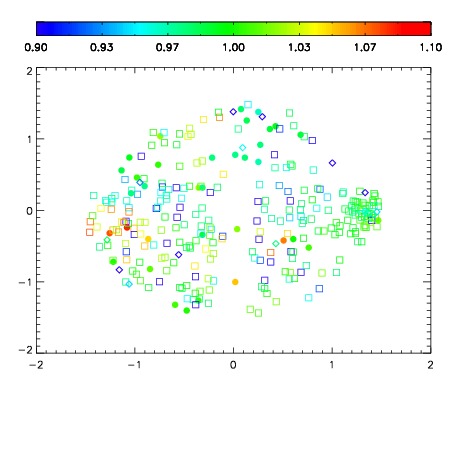
| Spatial sky telluric CO2 absorption deviations (filled: H < 10)
|
| 19070016
| 94
| | Red | Green | Blue
| | z | | 19.88
| | znorm | | 14.94
| | sky | 14.8 | 14.4 | 14.4
| | S/N | 27.8 | 39.6 | 44.4
| | S/N(c) | 16.2 | 50.5 | 38.7
| | SN(E/C) 0.49
|
| 
| 
| 
| 
| 
|
| 19070017
| 94
| | Red | Green | Blue
| | z | | 19.90
| | znorm | | 14.97
| | sky | 14.7 | 14.6 | 14.5
| | S/N | 27.6 | 39.5 | 45.1
| | S/N(c) | 16.3 | 51.0 | 38.4
| | SN(E/C) 0.58
|
| 
| 
| 
| 
| 
|
| 19070018
| 94
| | Red | Green | Blue
| | z | | 19.81
| | znorm | | 14.88
| | sky | 14.8 | 14.7 | 14.5
| | S/N | 26.5 | 37.5 | 42.9
| | S/N(c) | 15.5 | 49.0 | 36.8
| | SN(E/C) 0.70
|
| 
| 
| 
| 
| 
|
| 19070019
| 94
| | Red | Green | Blue
| | z | | 19.94
| | znorm | | 15.01
| | sky | 14.9 | 14.7 | 14.6
| | S/N | 28.0 | 39.7 | 46.8
| | S/N(c) | 16.6 | 52.1 | 38.5
| | SN(E/C) 0.61
|
| 
| 
| 
| 
| 
|
| 19070020
| 94
| | Red | Green | Blue
| | z | | 19.94
| | znorm | | 15.00
| | sky | 14.8 | 14.7 | 14.6
| | S/N | 27.7 | 40.0 | 46.5
| | S/N(c) | 16.7 | 51.9 | 38.3
| | SN(E/C) 0.64
|
| 
| 
| 
| 
| 
|
| 19070021
| 94
| | Red | Green | Blue
| | z | | 19.92
| | znorm | | 14.98
| | sky | 14.9 | 14.9 | 14.6
| | S/N | 27.1 | 38.9 | 45.5
| | S/N(c) | 16.6 | 51.2 | 39.2
| | SN(E/C) 0.53
|
| 
| 
| 
| 
| 
|