| Red | Green | Blue | |
| z | 17.64 | ||
| znorm | Inf | ||
| sky | -Inf | -Inf | -Inf |
| S/N | 42.6 | 64.0 | 74.7 |
| S/N(c) | 0.0 | 0.0 | 0.0 |
| SN(E/C) |


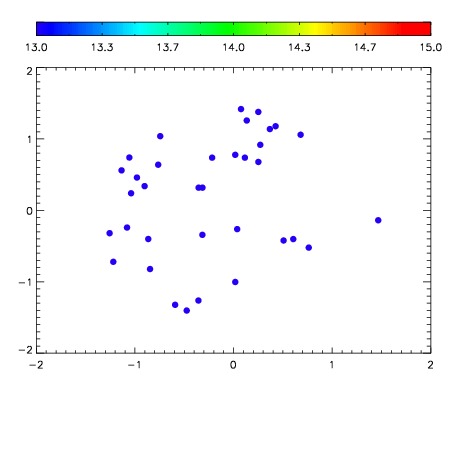

| Frame | Nreads | Zeropoints | Mag plots | Spatial mag deviation | Spatial sky 16325A emission deviations (filled: sky, open: star) | Spatial sky continuum emission | Spatial sky telluric CO2 absorption deviations (filled: H < 10) | |||||||||||||||||||||||
| 0 | 0 |
|
|
|
|
|
|
| IPAIR | NAME | SHIFT | NEWSHIFT | S/N | NAME | SHIFT | NEWSHIFT | S/N |
| 0 | 19070020 | 0.000993198 | 0.00000 | 19.9195 | 19070021 | -0.498963 | 0.499956 | 19.8953 |
| 1 | 19070019 | 0.000623503 | 0.000369695 | 19.9188 | 19070017 | -0.500939 | 0.501932 | 19.8810 |
| 2 | 19070016 | 0.00000 | 0.000993198 | 19.8549 | 19070018 | -0.500771 | 0.501764 | 19.7893 |