| Red | Green | Blue | |
| z | 17.64 | ||
| znorm | Inf | ||
| sky | -Inf | -Inf | -NaN |
| S/N | 19.8 | 33.1 | 37.0 |
| S/N(c) | 0.0 | 0.0 | 0.0 |
| SN(E/C) |
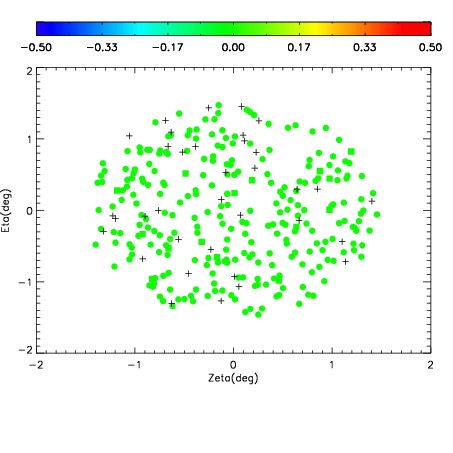
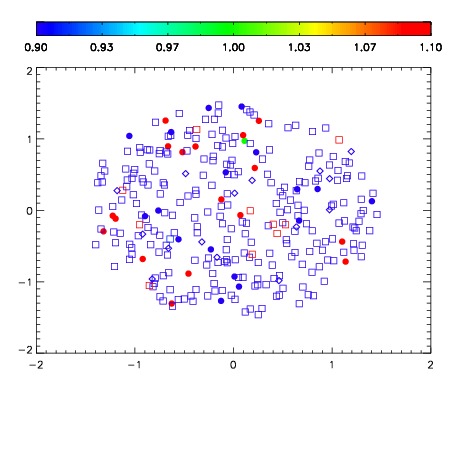
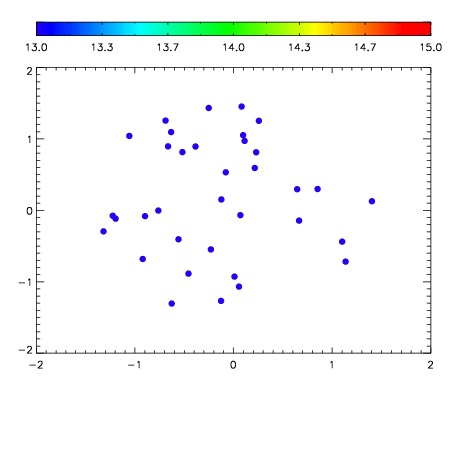

| Frame | Nreads | Zeropoints | Mag plots | Spatial mag deviation | Spatial sky 16325A emission deviations (filled: sky, open: star) | Spatial sky continuum emission | Spatial sky telluric CO2 absorption deviations (filled: H < 10) | |||||||||||||||||||||||
| 0 | 0 |
|
|
|
|
|
|
| IPAIR | NAME | SHIFT | NEWSHIFT | S/N | NAME | SHIFT | NEWSHIFT | S/N |
| 0 | 19010058 | 0.00000 | 0.00000 | 18.1698 | 19010059 | -0.503557 | 0.503557 | 18.0888 |
| 1 | 19010062 | -0.00100997 | 0.00100997 | 18.6360 | 19010063 | -0.503577 | 0.503577 | 18.6448 |
| 2 | 19010066 | -0.00107968 | 0.00107968 | 18.3444 | 19010067 | -0.503439 | 0.503439 | 18.3416 |
| 3 | 19010065 | -0.00238711 | 0.00238711 | 18.2942 | 19010064 | -0.503491 | 0.503491 | 18.2744 |
| 4 | 19010061 | -0.000956566 | 0.000956566 | 18.1003 | 19010060 | -0.504310 | 0.504310 | 18.0522 |