| Red | Green | Blue | |
| z | 17.64 | ||
| znorm | Inf | ||
| sky | -Inf | -Inf | -NaN |
| S/N | 26.6 | 48.7 | 53.0 |
| S/N(c) | 0.0 | 0.0 | 0.0 |
| SN(E/C) |
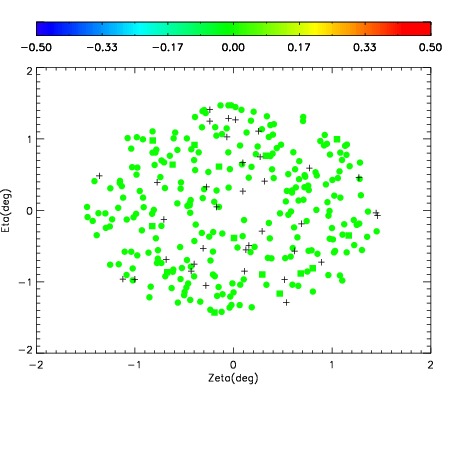
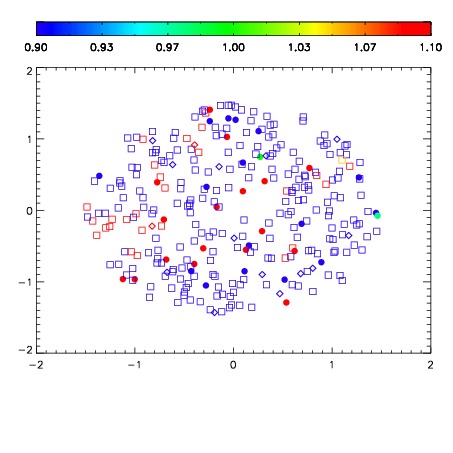
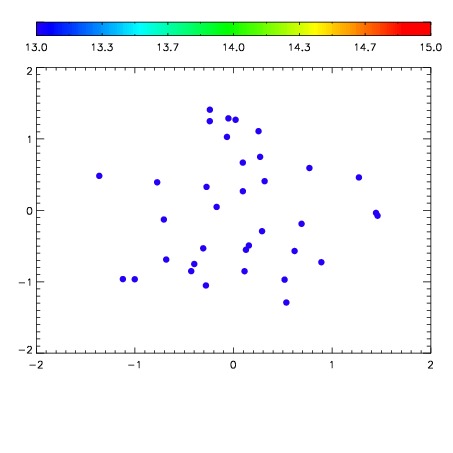

| Frame | Nreads | Zeropoints | Mag plots | Spatial mag deviation | Spatial sky 16325A emission deviations (filled: sky, open: star) | Spatial sky continuum emission | Spatial sky telluric CO2 absorption deviations (filled: H < 10) | |||||||||||||||||||||||
| 0 | 0 |
|
|
|
|
|
|
| IPAIR | NAME | SHIFT | NEWSHIFT | S/N | NAME | SHIFT | NEWSHIFT | S/N |
| 0 | 19300054 | 0.498621 | 0.00000 | 18.5610 | 19300055 | 0.00175044 | 0.496871 | 18.5750 |
| 1 | 19300066 | 0.496743 | 0.00187799 | 18.7860 | 19300067 | -0.00104436 | 0.499665 | 18.7787 |
| 2 | 19300061 | 0.497190 | 0.00143099 | 18.6056 | 19300060 | 0.000563404 | 0.498058 | 18.6755 |
| 3 | 19300058 | 0.496247 | 0.00237399 | 18.5338 | 19300064 | -0.000712245 | 0.499333 | 18.4888 |
| 4 | 19300065 | 0.495177 | 0.00344399 | 18.4855 | 19300059 | -9.49993e-05 | 0.498716 | 18.4883 |
| 5 | 19300053 | 0.497220 | 0.00140098 | 18.4614 | 19300052 | 0.00000 | 0.498621 | 18.3447 |
| 6 | 19300057 | 0.497064 | 0.00155699 | 18.2445 | 19300056 | 0.000379010 | 0.498242 | 18.2836 |
| 7 | 19300062 | 0.498076 | 0.000544995 | 18.0519 | 19300063 | 0.000899173 | 0.497722 | 18.0230 |
| 8 | 19300069 | 0.495132 | 0.00348899 | 17.4821 | 19300068 | -0.00173088 | 0.500352 | 17.6778 |