| Red | Green | Blue | |
| z | 17.64 | ||
| znorm | Inf | ||
| sky | -Inf | -Inf | -Inf |
| S/N | 23.5 | 40.3 | 47.7 |
| S/N(c) | 0.0 | 0.0 | 0.0 |
| SN(E/C) |
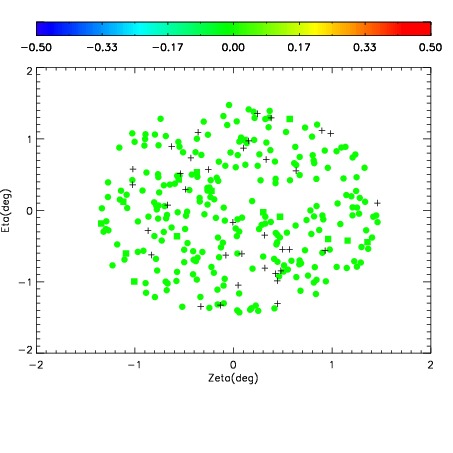
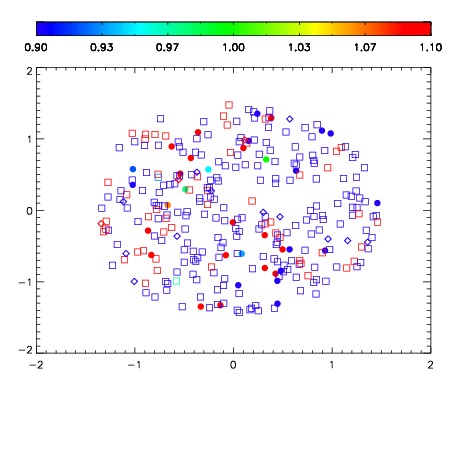
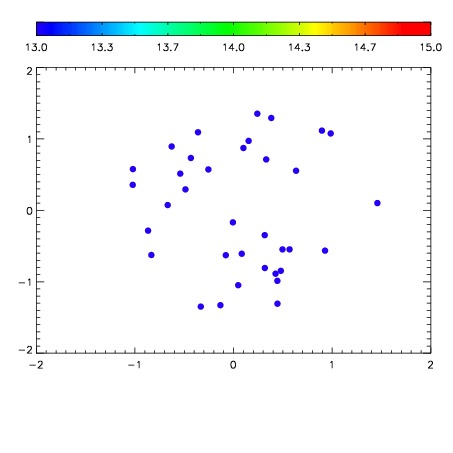

| Frame | Nreads | Zeropoints | Mag plots | Spatial mag deviation | Spatial sky 16325A emission deviations (filled: sky, open: star) | Spatial sky continuum emission | Spatial sky telluric CO2 absorption deviations (filled: H < 10) | |||||||||||||||||||||||
| 0 | 0 |
|
|
|
|
|
|
| IPAIR | NAME | SHIFT | NEWSHIFT | S/N | NAME | SHIFT | NEWSHIFT | S/N |
| 0 | 19740038 | 0.498187 | 0.00000 | 18.4618 | 19740032 | 0.00238388 | 0.495803 | 18.4118 |
| 1 | 19740035 | 0.496173 | 0.00201401 | 18.5547 | 19740036 | 0.00527953 | 0.492907 | 18.4920 |
| 2 | 19740030 | 0.495507 | 0.00268000 | 18.4883 | 19740029 | 0.00000 | 0.498187 | 18.4255 |
| 3 | 19740031 | 0.498110 | 7.70092e-05 | 18.3519 | 19740037 | 0.00703516 | 0.491152 | 18.4115 |
| 4 | 19740034 | 0.495689 | 0.00249800 | 18.0228 | 19740033 | 0.00293737 | 0.495250 | 18.0227 |