| Red | Green | Blue | |
| z | 17.64 | ||
| znorm | Inf | ||
| sky | -Inf | -Inf | -Inf |
| S/N | 17.6 | 31.2 | 36.6 |
| S/N(c) | 0.0 | 0.0 | 0.0 |
| SN(E/C) |
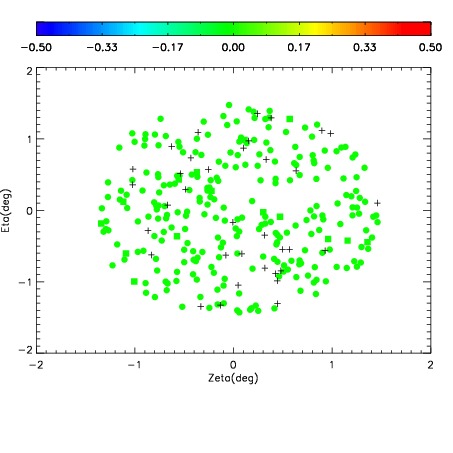
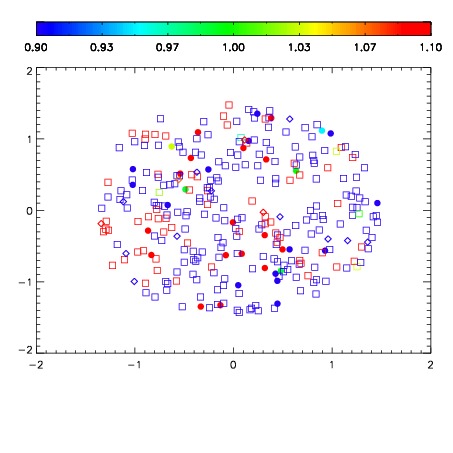
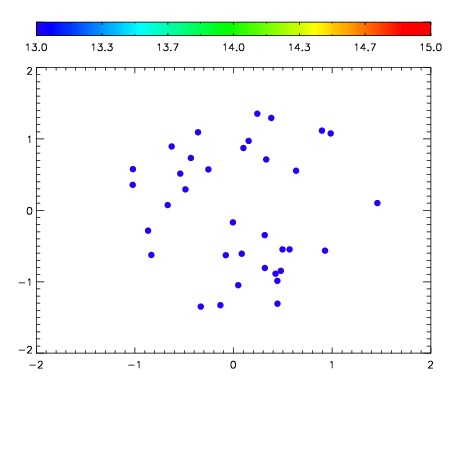

| Frame | Nreads | Zeropoints | Mag plots | Spatial mag deviation | Spatial sky 16325A emission deviations (filled: sky, open: star) | Spatial sky continuum emission | Spatial sky telluric CO2 absorption deviations (filled: H < 10) | |||||||||||||||||||||||
| 0 | 0 |
|
|
|
|
|
|
| IPAIR | NAME | SHIFT | NEWSHIFT | S/N | NAME | SHIFT | NEWSHIFT | S/N |
| 0 | 19750035 | 0.496067 | 0.00000 | 18.4709 | 19750034 | 0.000715284 | 0.495352 | 18.4342 |
| 1 | 19750032 | 0.492059 | 0.00400800 | 18.5378 | 19750033 | -0.000401015 | 0.496468 | 18.5070 |
| 2 | 19750036 | 0.495959 | 0.000107974 | 17.7463 | 19750030 | 0.00000 | 0.496067 | 17.6917 |
| 3 | 19750031 | 0.492034 | 0.00403300 | 16.9860 | 19750037 | 0.000488874 | 0.495578 | 17.6799 |