| Red | Green | Blue | |
| z | 17.64 | ||
| znorm | Inf | ||
| sky | -Inf | -NaN | -NaN |
| S/N | 29.1 | 50.6 | 63.5 |
| S/N(c) | 0.0 | 0.0 | 0.0 |
| SN(E/C) |
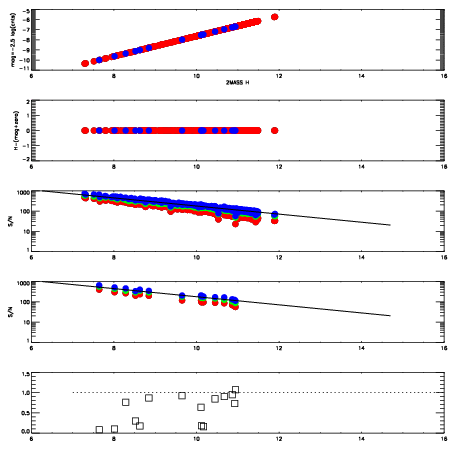
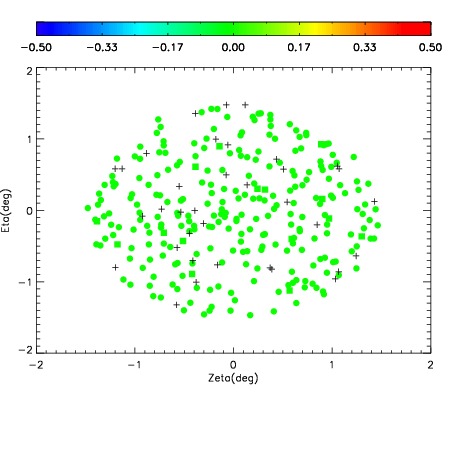
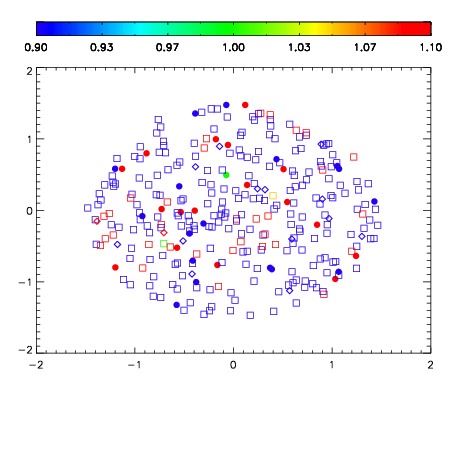
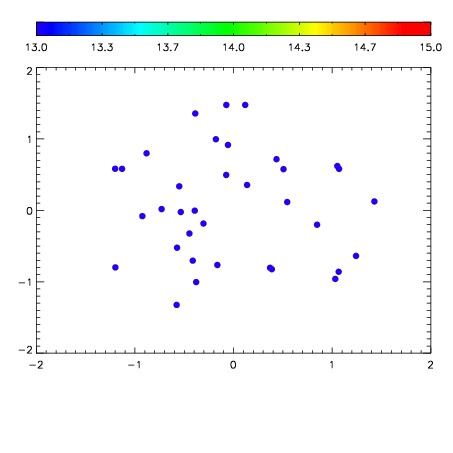

| Frame | Nreads | Zeropoints | Mag plots | Spatial mag deviation | Spatial sky 16325A emission deviations (filled: sky, open: star) | Spatial sky continuum emission | Spatial sky telluric CO2 absorption deviations (filled: H < 10) | |||||||||||||||||||||||
| 0 | 0 |
|
|
|
|
|
|
| IPAIR | NAME | SHIFT | NEWSHIFT | S/N | NAME | SHIFT | NEWSHIFT | S/N |
| 0 | 19130021 | 0.502003 | 0.00000 | 18.4122 | 19130023 | 0.00250677 | 0.499496 | 18.2881 |
| 1 | 19130012 | 0.498573 | 0.00343001 | 18.6860 | 19130011 | 0.00000 | 0.502003 | 18.7135 |
| 2 | 19130017 | 0.500987 | 0.00101602 | 18.5520 | 19130026 | 0.00104696 | 0.500956 | 18.6003 |
| 3 | 19130025 | 0.500098 | 0.00190502 | 18.5413 | 19130018 | 0.00187050 | 0.500133 | 18.5811 |
| 4 | 19130028 | 0.499524 | 0.00247902 | 18.5182 | 19130027 | 0.00126849 | 0.500735 | 18.5230 |
| 5 | 19130020 | 0.500408 | 0.00159502 | 18.4653 | 19130019 | 0.000967935 | 0.501035 | 18.4920 |
| 6 | 19130016 | 0.501641 | 0.000362039 | 18.3540 | 19130022 | 0.00329910 | 0.498704 | 18.2799 |
| 7 | 19130024 | 0.499137 | 0.00286600 | 18.2574 | 19130015 | 0.00142391 | 0.500579 | 18.2792 |
| 8 | 19130013 | 0.499327 | 0.00267601 | 18.1581 | 19130014 | 0.000523420 | 0.501480 | 18.2599 |
| 9 | 19130029 | 0.500504 | 0.00149900 | 18.0131 | 19130030 | -0.00645241 | 0.508455 | 17.9824 |