| Red | Green | Blue | |
| z | 17.64 | ||
| znorm | Inf | ||
| sky | -NaN | -Inf | -Inf |
| S/N | 28.1 | 49.7 | 56.3 |
| S/N(c) | 0.0 | 0.0 | 0.0 |
| SN(E/C) |
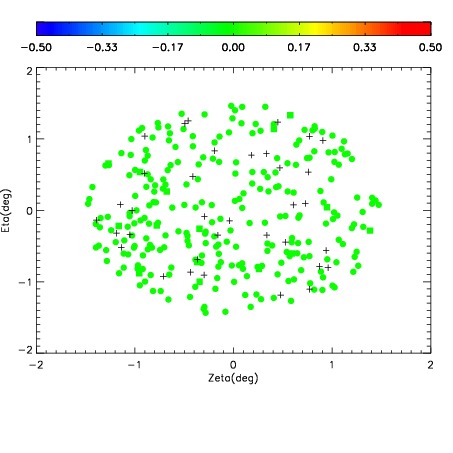

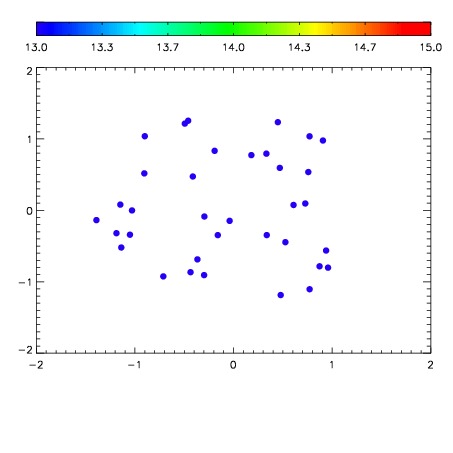

| Frame | Nreads | Zeropoints | Mag plots | Spatial mag deviation | Spatial sky 16325A emission deviations (filled: sky, open: star) | Spatial sky continuum emission | Spatial sky telluric CO2 absorption deviations (filled: H < 10) | |||||||||||||||||||||||
| 0 | 0 |
|
|
|
|
|
|
| IPAIR | NAME | SHIFT | NEWSHIFT | S/N | NAME | SHIFT | NEWSHIFT | S/N |
| 0 | 19580037 | 0.498342 | 0.00000 | 17.6750 | 19580038 | 0.00301217 | 0.495330 | 17.7600 |
| 1 | 19580041 | 0.496478 | 0.00186402 | 18.4842 | 19580035 | 0.000480560 | 0.497861 | 18.5367 |
| 2 | 19580036 | 0.497388 | 0.000954002 | 18.4731 | 19580042 | 0.000325208 | 0.498017 | 18.4919 |
| 3 | 19580028 | 0.496563 | 0.00177902 | 18.4674 | 19580030 | 0.00519964 | 0.493142 | 18.4755 |
| 4 | 19580029 | 0.497348 | 0.000993997 | 18.4512 | 19580034 | -0.000607281 | 0.498949 | 18.4448 |
| 5 | 19580033 | 0.496637 | 0.00170502 | 18.4405 | 19580027 | 0.00000 | 0.498342 | 18.2208 |
| 6 | 19580040 | 0.495722 | 0.00262001 | 18.2899 | 19580031 | 0.00391784 | 0.494424 | 18.1710 |
| 7 | 19580032 | 0.496514 | 0.00182801 | 18.1660 | 19580039 | 0.00258462 | 0.495757 | 18.1465 |
| 8 | 19580044 | 0.496154 | 0.00218800 | 17.1558 | 19580043 | -8.83958e-05 | 0.498430 | 17.5018 |