| Red | Green | Blue | |
| z | 17.64 | ||
| znorm | Inf | ||
| sky | -Inf | -Inf | -NaN |
| S/N | 32.8 | 55.2 | 62.9 |
| S/N(c) | 0.0 | 0.0 | 0.0 |
| SN(E/C) |
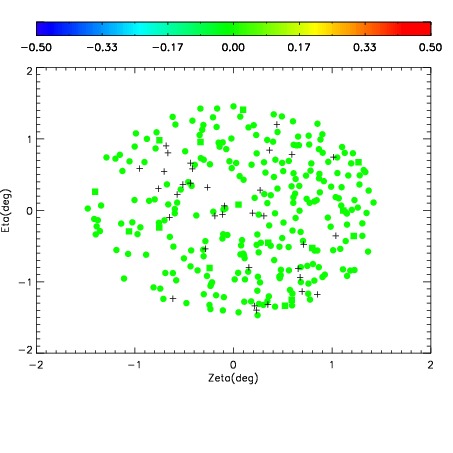
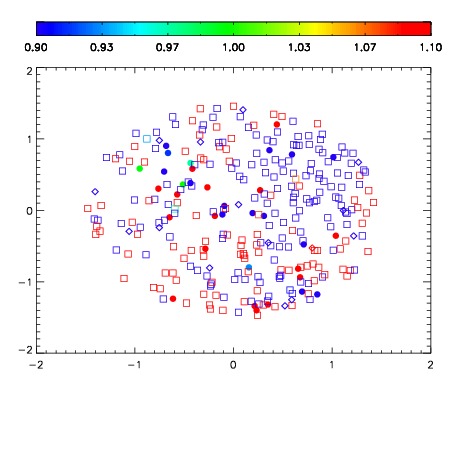


| Frame | Nreads | Zeropoints | Mag plots | Spatial mag deviation | Spatial sky 16325A emission deviations (filled: sky, open: star) | Spatial sky continuum emission | Spatial sky telluric CO2 absorption deviations (filled: H < 10) | |||||||||||||||||||||||
| 0 | 0 |
|
|
|
|
|
|
| IPAIR | NAME | SHIFT | NEWSHIFT | S/N | NAME | SHIFT | NEWSHIFT | S/N |
| 0 | 19700061 | 0.495867 | 0.00000 | 19.0682 | 19700058 | -0.00281360 | 0.498681 | 19.0392 |
| 1 | 19700057 | 0.489251 | 0.00661603 | 19.0608 | 19700059 | -0.00330302 | 0.499170 | 19.0341 |
| 2 | 19700060 | 0.494126 | 0.00174102 | 19.0606 | 19700062 | -7.51994e-05 | 0.495942 | 19.0329 |
| 3 | 19700056 | 0.487760 | 0.00810701 | 18.9964 | 19700054 | -0.00656743 | 0.502434 | 18.9016 |
| 4 | 19700053 | 0.489358 | 0.00650901 | 18.9480 | 19700055 | -0.00580425 | 0.501671 | 18.8677 |
| 5 | 19700052 | 0.488153 | 0.00771400 | 18.8505 | 19700051 | 0.00000 | 0.495867 | 18.7921 |