| Red | Green | Blue | |
| z | 17.65 | ||
| znorm | Inf | ||
| sky | -Inf | -Inf | -NaN |
| S/N | 24.0 | 38.7 | 45.0 |
| S/N(c) | 58.6 | 16.5 | 23.3 |
| SN(E/C) |
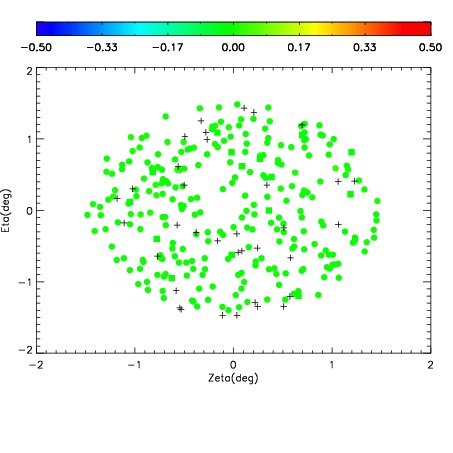
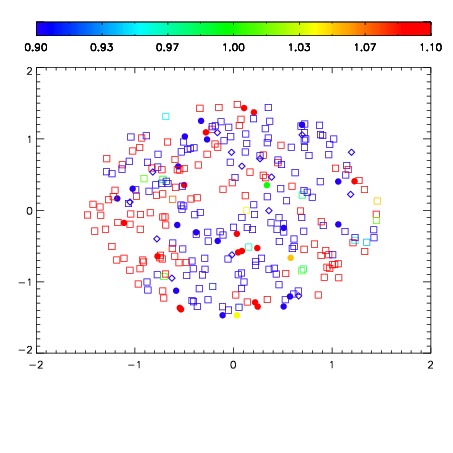
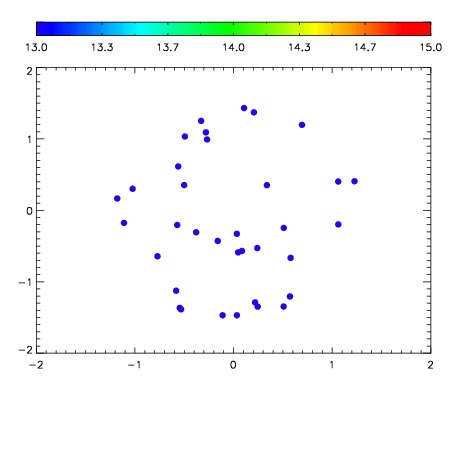

| Frame | Nreads | Zeropoints | Mag plots | Spatial mag deviation | Spatial sky 16325A emission deviations (filled: sky, open: star) | Spatial sky continuum emission | Spatial sky telluric CO2 absorption deviations (filled: H < 10) | |||||||||||||||||||||||
| 0 | 0 |
|
|
|
|
|
|
| IPAIR | NAME | SHIFT | NEWSHIFT | S/N | NAME | SHIFT | NEWSHIFT | S/N |
| 0 | 19620013 | 0.497669 | 0.00000 | 18.4114 | 19620018 | 0.00180532 | 0.495864 | 18.2277 |
| 1 | 19620017 | 0.496190 | 0.00147900 | 18.5149 | 19620014 | -0.00104762 | 0.498717 | 18.5818 |
| 2 | 19620016 | 0.497278 | 0.000391006 | 18.4288 | 19620015 | -0.00157478 | 0.499244 | 18.5206 |
| 3 | 19620012 | 0.497243 | 0.000426024 | 18.1585 | 19620011 | 0.00000 | 0.497669 | 18.1623 |