| Red | Green | Blue | |
| z | 17.65 | ||
| znorm | Inf | ||
| sky | -Inf | -Inf | -Inf |
| S/N | 20.3 | 30.2 | 34.3 |
| S/N(c) | 51.8 | 0.6 | 15.8 |
| SN(E/C) |
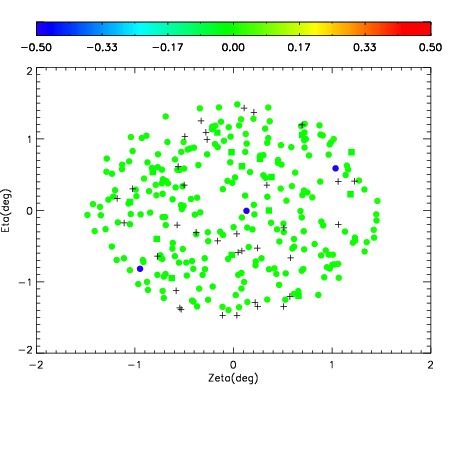
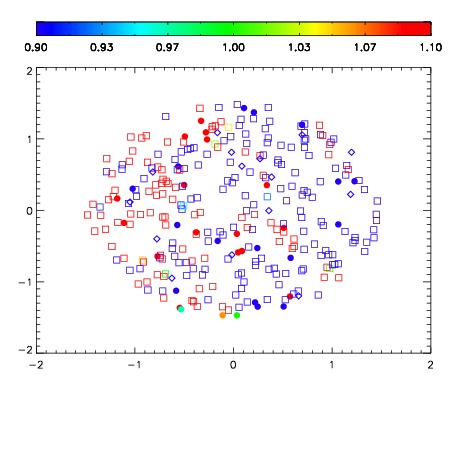
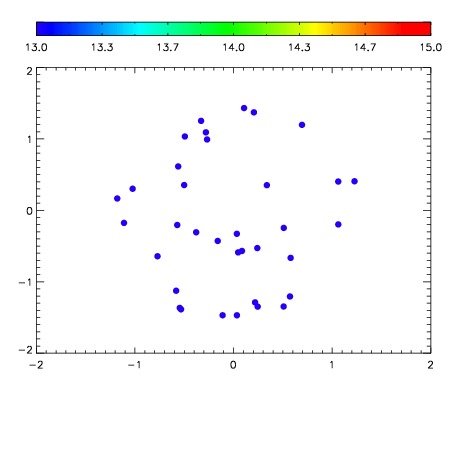

| Frame | Nreads | Zeropoints | Mag plots | Spatial mag deviation | Spatial sky 16325A emission deviations (filled: sky, open: star) | Spatial sky continuum emission | Spatial sky telluric CO2 absorption deviations (filled: H < 10) | |||||||||||||||||||||||
| 0 | 0 |
|
|
|
|
|
|
| IPAIR | NAME | SHIFT | NEWSHIFT | S/N | NAME | SHIFT | NEWSHIFT | S/N |
| 0 | 19660031 | 0.488674 | 0.00000 | 16.6144 | 19660030 | 0.00000 | 0.488674 | 16.5168 |
| 1 | 19660035 | 0.488076 | 0.000598013 | 19.0854 | 19660034 | 0.00171307 | 0.486961 | 19.0727 |
| 2 | 19660032 | 0.488535 | 0.000139028 | 16.7923 | 19660033 | 0.00122348 | 0.487451 | 19.0644 |