| Red | Green | Blue | |
| z | 17.64 | ||
| znorm | Inf | ||
| sky | -NaN | -Inf | -NaN |
| S/N | 26.1 | 42.0 | 49.8 |
| S/N(c) | 13.5 | 101.5 | 53.7 |
| SN(E/C) |
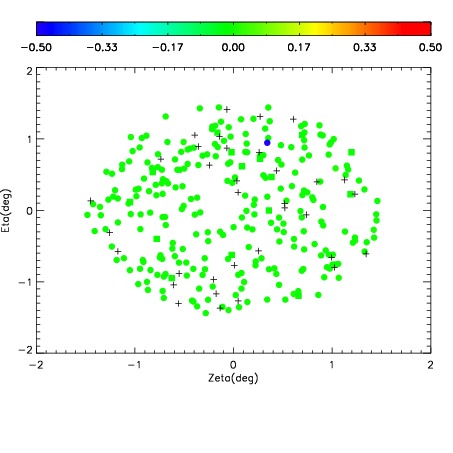

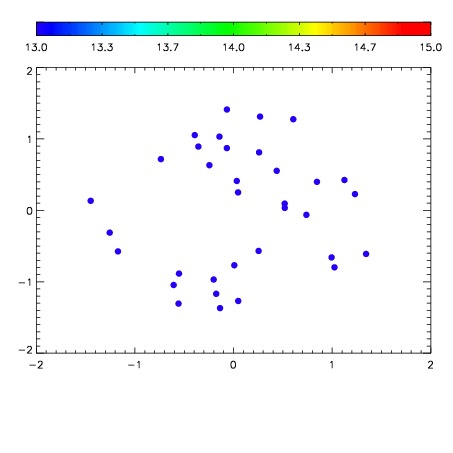

| Frame | Nreads | Zeropoints | Mag plots | Spatial mag deviation | Spatial sky 16325A emission deviations (filled: sky, open: star) | Spatial sky continuum emission | Spatial sky telluric CO2 absorption deviations (filled: H < 10) | |||||||||||||||||||||||
| 0 | 0 |
|
|
|
|
|
|
| IPAIR | NAME | SHIFT | NEWSHIFT | S/N | NAME | SHIFT | NEWSHIFT | S/N |
| 0 | 19370062 | 0.492414 | 0.00000 | 18.8460 | 19370060 | 0.00159641 | 0.490818 | 18.9119 |
| 1 | 19370061 | 0.491653 | 0.000761002 | 18.8314 | 19370063 | -0.00165183 | 0.494066 | 18.8144 |
| 2 | 19370058 | 0.491670 | 0.000743985 | 18.7685 | 19370059 | 0.000977742 | 0.491436 | 18.8096 |
| 3 | 19370057 | 0.491043 | 0.00137100 | 18.6881 | 19370056 | 0.00000 | 0.492414 | 18.6532 |