| Red | Green | Blue | |
| z | 17.64 | ||
| znorm | Inf | ||
| sky | -Inf | -Inf | -NaN |
| S/N | 22.0 | 33.3 | 40.7 |
| S/N(c) | 57.2 | 16.2 | 15.8 |
| SN(E/C) |
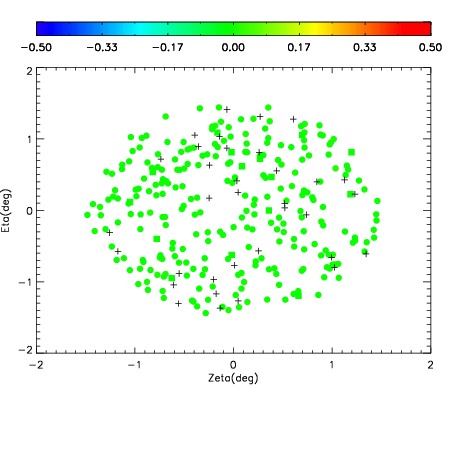
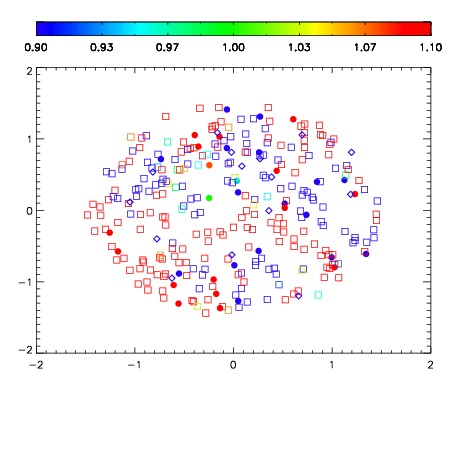
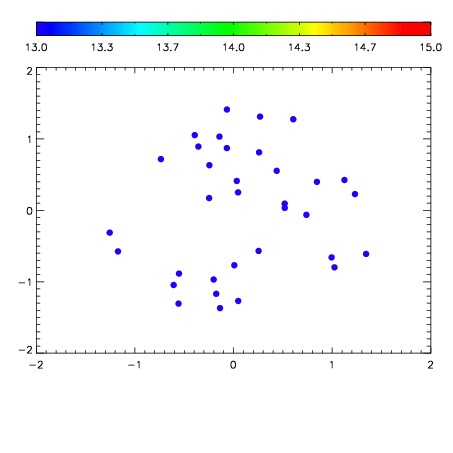

| Frame | Nreads | Zeropoints | Mag plots | Spatial mag deviation | Spatial sky 16325A emission deviations (filled: sky, open: star) | Spatial sky continuum emission | Spatial sky telluric CO2 absorption deviations (filled: H < 10) | |||||||||||||||||||||||
| 0 | 0 |
|
|
|
|
|
|
| IPAIR | NAME | SHIFT | NEWSHIFT | S/N | NAME | SHIFT | NEWSHIFT | S/N |
| 0 | 19600034 | 0.502759 | 0.00000 | 18.9901 | 19600035 | 0.00100035 | 0.501759 | 18.9662 |
| 1 | 19600033 | 0.501360 | 0.00139898 | 19.0168 | 19600032 | 0.00000 | 0.502759 | 19.0172 |
| 2 | 19600037 | 0.499479 | 0.00327998 | 17.2812 | 19600036 | -0.000331401 | 0.503090 | 16.7093 |