| Red | Green | Blue | |
| z | 17.63 | ||
| znorm | Inf | ||
| sky | -NaN | -Inf | -NaN |
| S/N | 35.5 | 53.4 | 65.4 |
| S/N(c) | 90.0 | 25.2 | 24.9 |
| SN(E/C) |
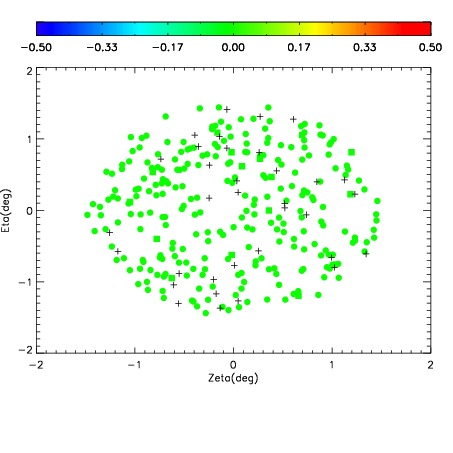
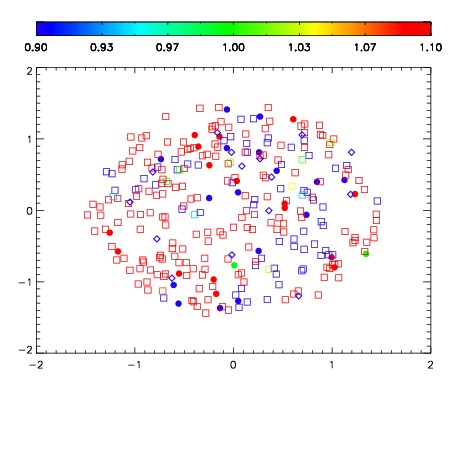
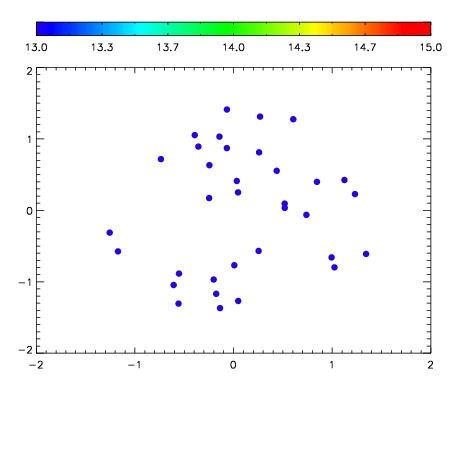

| Frame | Nreads | Zeropoints | Mag plots | Spatial mag deviation | Spatial sky 16325A emission deviations (filled: sky, open: star) | Spatial sky continuum emission | Spatial sky telluric CO2 absorption deviations (filled: H < 10) | |||||||||||||||||||||||
| 0 | 0 |
|
|
|
|
|
|
| IPAIR | NAME | SHIFT | NEWSHIFT | S/N | NAME | SHIFT | NEWSHIFT | S/N |
| 0 | 19670037 | 0.494735 | 0.00000 | 19.0649 | 19670044 | 0.00136776 | 0.493367 | 18.9472 |
| 1 | 19670038 | 0.494577 | 0.000158012 | 19.0740 | 19670036 | 0.00000 | 0.494735 | 19.0594 |
| 2 | 19670041 | 0.493092 | 0.00164300 | 19.0700 | 19670039 | 0.000575475 | 0.494160 | 19.0427 |
| 3 | 19670042 | 0.493520 | 0.00121501 | 19.0694 | 19670047 | -0.00292938 | 0.497664 | 19.0086 |
| 4 | 19670046 | 0.493383 | 0.00135201 | 19.0133 | 19670043 | 0.00135403 | 0.493381 | 18.8851 |