| Red | Green | Blue | |
| z | 17.64 | ||
| znorm | Inf | ||
| sky | -Inf | -NaN | -NaN |
| S/N | 34.0 | 52.5 | 65.6 |
| S/N(c) | 82.9 | 18.2 | 26.9 |
| SN(E/C) |
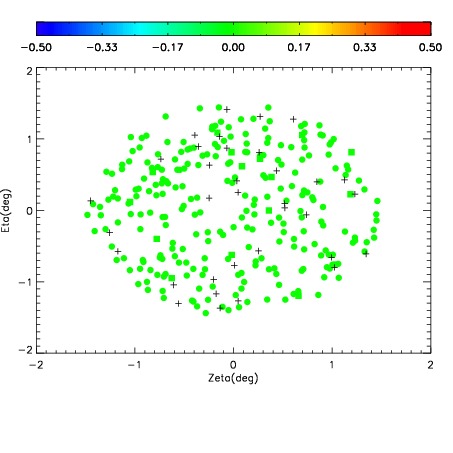
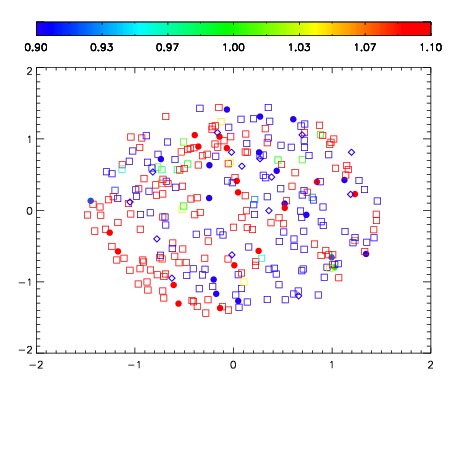
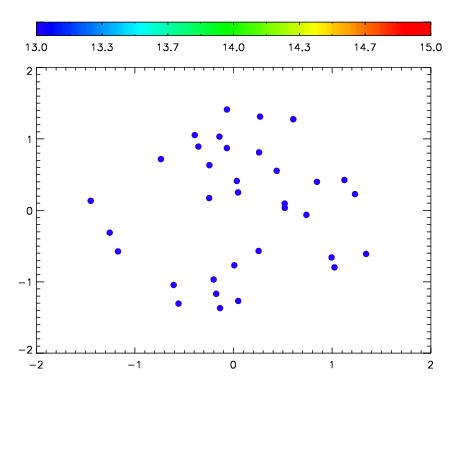

| Frame | Nreads | Zeropoints | Mag plots | Spatial mag deviation | Spatial sky 16325A emission deviations (filled: sky, open: star) | Spatial sky continuum emission | Spatial sky telluric CO2 absorption deviations (filled: H < 10) | |||||||||||||||||||||||
| 0 | 0 |
|
|
|
|
|
|
| IPAIR | NAME | SHIFT | NEWSHIFT | S/N | NAME | SHIFT | NEWSHIFT | S/N |
| 0 | 19700031 | 0.494030 | 0.00000 | 19.0031 | 19700026 | 0.00193028 | 0.492100 | 19.0365 |
| 1 | 19700028 | 0.492731 | 0.00129899 | 18.9983 | 19700025 | 0.00142174 | 0.492608 | 19.0117 |
| 2 | 19700027 | 0.491272 | 0.00275800 | 18.9955 | 19700029 | 0.00623066 | 0.487799 | 19.0102 |
| 3 | 19700024 | 0.489421 | 0.00460899 | 18.9741 | 19700030 | 0.00639699 | 0.487633 | 19.0082 |
| 4 | 19700023 | 0.489407 | 0.00462300 | 18.9182 | 19700022 | 0.00000 | 0.494030 | 18.8714 |