| Red | Green | Blue | |
| z | 17.64 | ||
| znorm | Inf | ||
| sky | -Inf | -Inf | -NaN |
| S/N | 32.2 | 49.8 | 58.4 |
| S/N(c) | 14.4 | 17.6 | 57.5 |
| SN(E/C) |
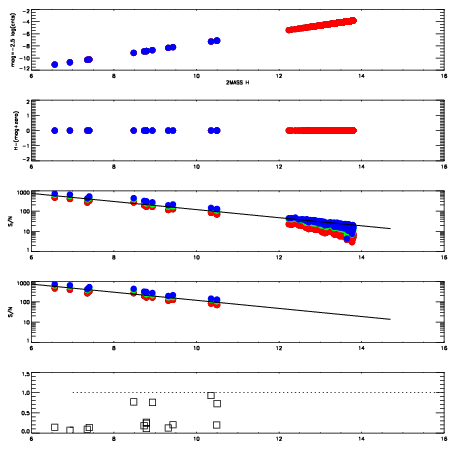
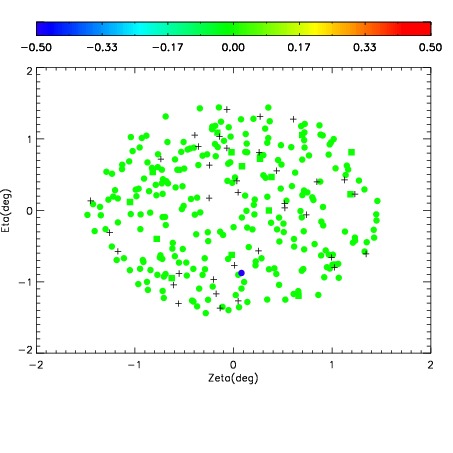
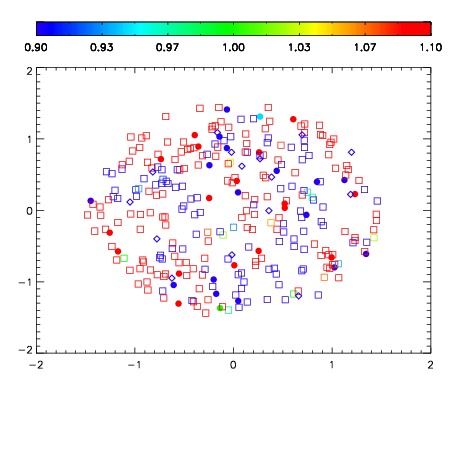
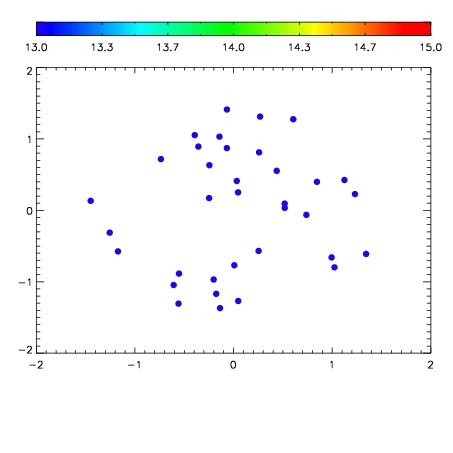

| Frame | Nreads | Zeropoints | Mag plots | Spatial mag deviation | Spatial sky 16325A emission deviations (filled: sky, open: star) | Spatial sky continuum emission | Spatial sky telluric CO2 absorption deviations (filled: H < 10) | |||||||||||||||||||||||
| 0 | 0 |
|
|
|
|
|
|
| IPAIR | NAME | SHIFT | NEWSHIFT | S/N | NAME | SHIFT | NEWSHIFT | S/N |
| 0 | 19910017 | 0.499183 | 0.00000 | 19.0391 | 19910018 | 0.00496295 | 0.494220 | 19.0343 |
| 1 | 19910016 | 0.498116 | 0.00106701 | 19.0252 | 19910015 | 0.00418313 | 0.495000 | 18.9969 |
| 2 | 19910013 | 0.498228 | 0.000954986 | 18.8693 | 19910014 | 0.00375437 | 0.495429 | 18.9014 |
| 3 | 19910012 | 0.497539 | 0.00164399 | 18.8318 | 19910011 | 0.00000 | 0.499183 | 18.8956 |