| Red | Green | Blue | |
| z | 17.65 | ||
| znorm | 12.71 | ||
| sky | 20.8 | 20.6 | 24.2 |
| S/N | 27.5 | 37.4 | 47.0 |
| S/N(c) | 43.6 | 29.4 | 15.8 |
| SN(E/C) |
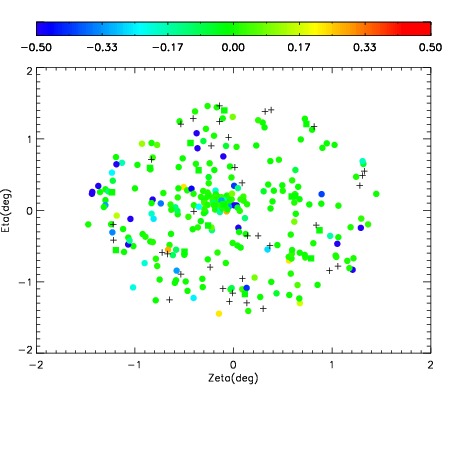
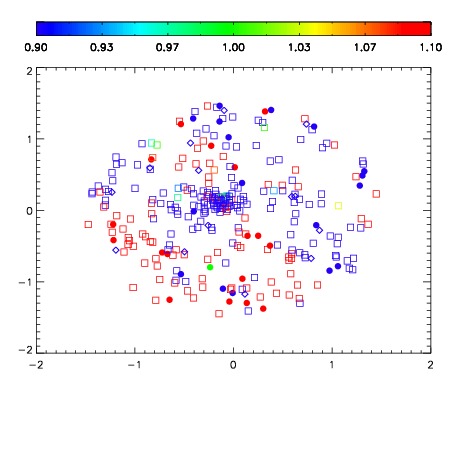
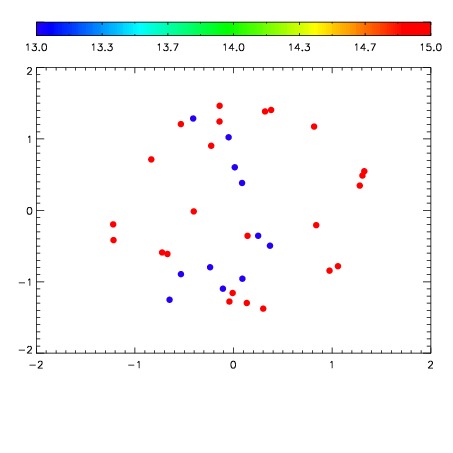

| Frame | Nreads | Zeropoints | Mag plots | Spatial mag deviation | Spatial sky 16325A emission deviations (filled: sky, open: star) | Spatial sky continuum emission | Spatial sky telluric CO2 absorption deviations (filled: H < 10) | |||||||||||||||||||||||
| 0 | 94 |
|
|
|
|
|
|
| IPAIR | NAME | SHIFT | NEWSHIFT | S/N | NAME | SHIFT | NEWSHIFT | S/N |
| 0 | 19330072 | 0.494544 | 0.00000 | 19.7755 | 19330071 | 0.00000 | 0.494544 | 19.8532 |