| Red | Green | Blue | |
| z | 17.64 | ||
| znorm | Inf | ||
| sky | -Inf | -Inf | -Inf |
| S/N | 35.2 | 48.4 | 59.7 |
| S/N(c) | 19.0 | 56.9 | 15.0 |
| SN(E/C) |
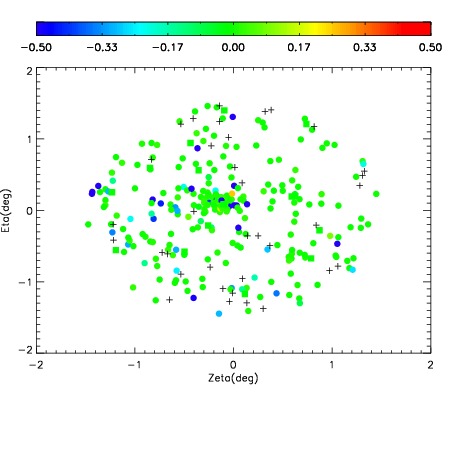
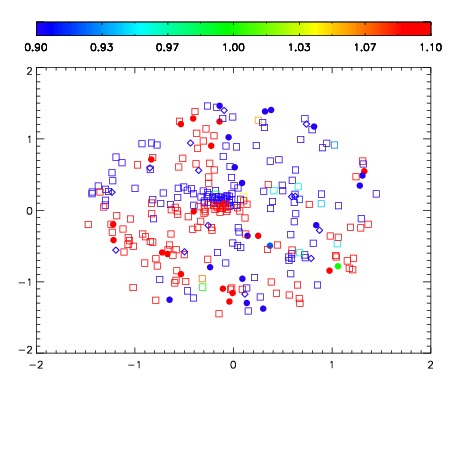
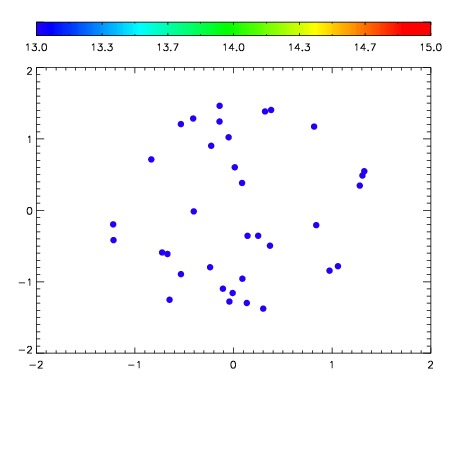

| Frame | Nreads | Zeropoints | Mag plots | Spatial mag deviation | Spatial sky 16325A emission deviations (filled: sky, open: star) | Spatial sky continuum emission | Spatial sky telluric CO2 absorption deviations (filled: H < 10) | |||||||||||||||||||||||
| 0 | 0 |
|
|
|
|
|
|
| IPAIR | NAME | SHIFT | NEWSHIFT | S/N | NAME | SHIFT | NEWSHIFT | S/N |
| 0 | 19620049 | 0.493502 | 0.00000 | 19.5407 | 19620047 | 0.00000 | 0.493502 | 19.4678 |
| 1 | 19620048 | 0.492345 | 0.00115699 | 19.5797 | 19620050 | 0.00135073 | 0.492151 | 19.5510 |