| Red | Green | Blue | |
| z | 17.64 | ||
| znorm | Inf | ||
| sky | -Inf | -Inf | -Inf |
| S/N | 37.3 | 52.5 | 62.7 |
| S/N(c) | 59.4 | 18.3 | 33.4 |
| SN(E/C) |
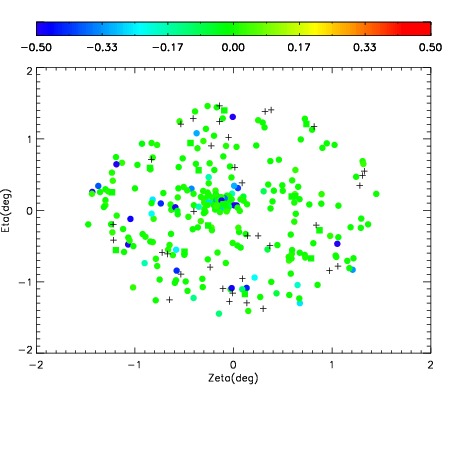
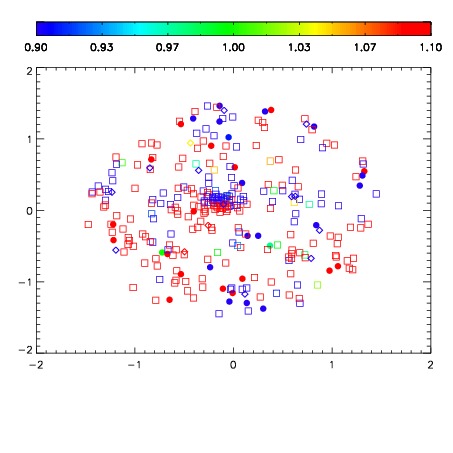
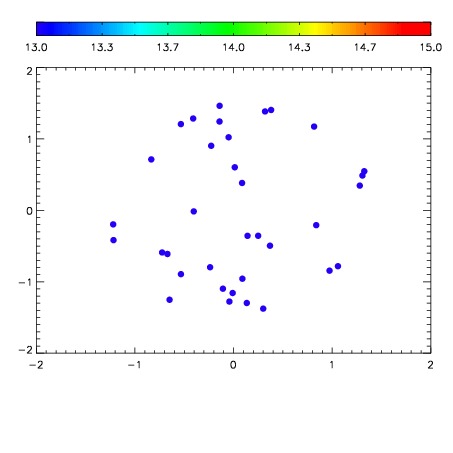

| Frame | Nreads | Zeropoints | Mag plots | Spatial mag deviation | Spatial sky 16325A emission deviations (filled: sky, open: star) | Spatial sky continuum emission | Spatial sky telluric CO2 absorption deviations (filled: H < 10) | |||||||||||||||||||||||
| 0 | 0 |
|
|
|
|
|
|
| IPAIR | NAME | SHIFT | NEWSHIFT | S/N | NAME | SHIFT | NEWSHIFT | S/N |
| 0 | 19670063 | 0.492276 | 0.00000 | 19.5642 | 19670062 | 0.00000 | 0.492276 | 19.6848 |
| 1 | 19670064 | 0.491688 | 0.000588000 | 19.7272 | 19670065 | -0.000644024 | 0.492920 | 19.7959 |