| Red | Green | Blue | |
| z | 17.65 | ||
| znorm | 12.71 | ||
| sky | 21.0 | 20.5 | 21.9 |
| S/N | 28.5 | 37.9 | 48.6 |
| S/N(c) | 22.6 | 66.6 | 12.3 |
| SN(E/C) |
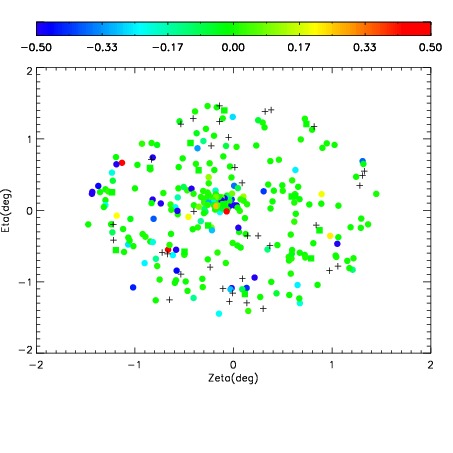
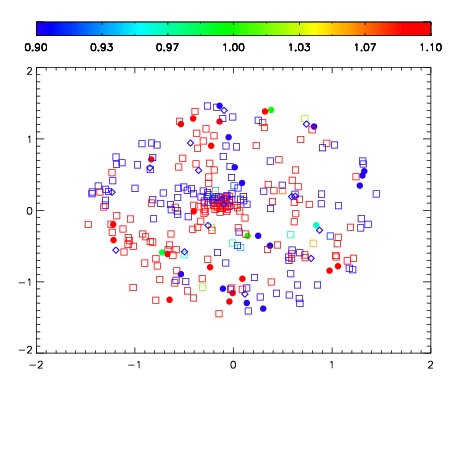
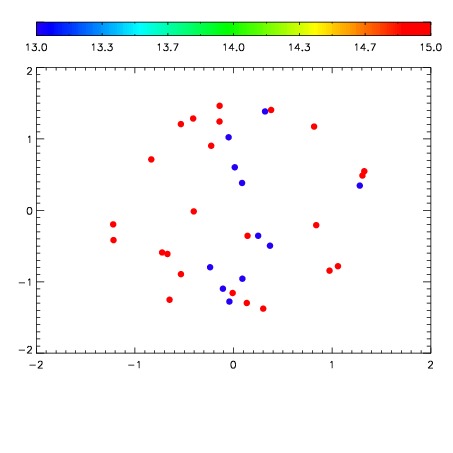

| Frame | Nreads | Zeropoints | Mag plots | Spatial mag deviation | Spatial sky 16325A emission deviations (filled: sky, open: star) | Spatial sky continuum emission | Spatial sky telluric CO2 absorption deviations (filled: H < 10) | |||||||||||||||||||||||
| 0 | 94 |
|
|
|
|
|
|
| IPAIR | NAME | SHIFT | NEWSHIFT | S/N | NAME | SHIFT | NEWSHIFT | S/N |
| 0 | 19700046 | 0.00000 | 0.00000 | 19.7149 | 19700047 | -0.489274 | 0.489274 | 19.7646 |